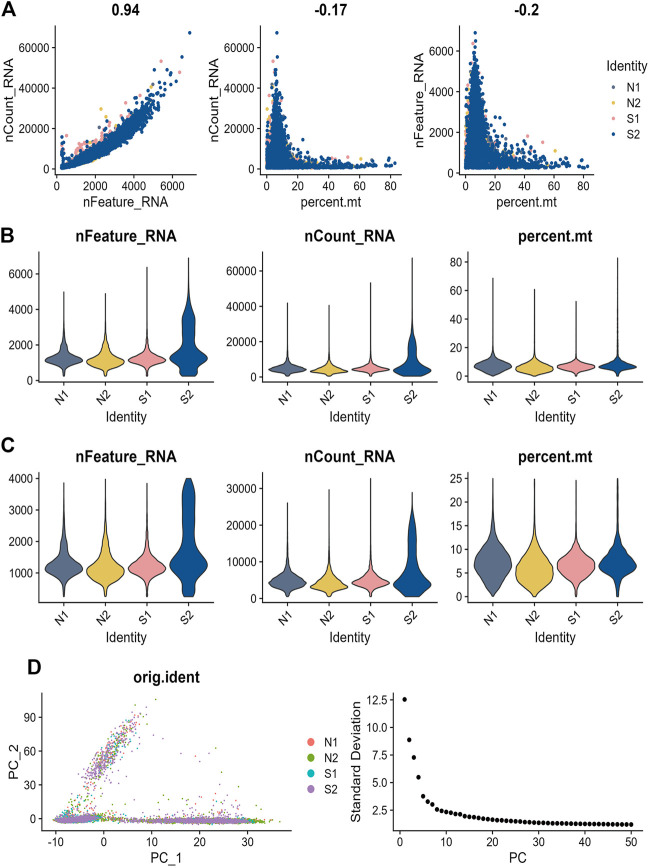
FIGURE 6.
Sepsis single cell data quality control process (A) Analysis of the correlation between gene expression and cell counts and mitochondrial content in each sample. (B) Precent. mt, nFeatureRNA, and nCountRNA for each sample before filtering (C) nCount RNA, nFeature RNA, and precent. mt for each sample after filtration (D) Principal component analysis (PCA) plot, where each dot in the plot, represents a cell. Elbow plot, a method used to determine the number of PCs.

