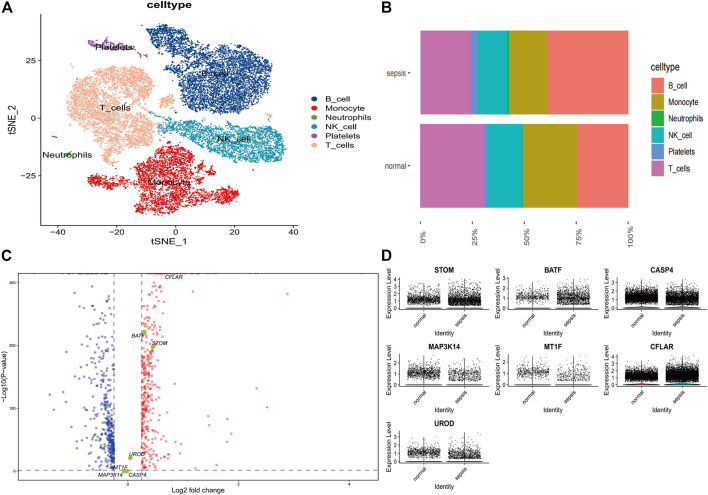
FIGURE 7.
Single-cell subpopulation identification and expression levels of diagnostic genes in Sepsis and normal groups (A) TSNE display plot of cell subpopulations in Sepsis patients (B) Comparison of immune cell composition in patients with Sepsis and normal (C) Volcano diagram showing differential genes, with red dots representing upregulated genes, blue dots representing downregulated genes and yellow dots representing hub genes (D) An expression plot showing the levels of diagnostic genes in Sepsis patients and normal individuals.

