Figure 5.
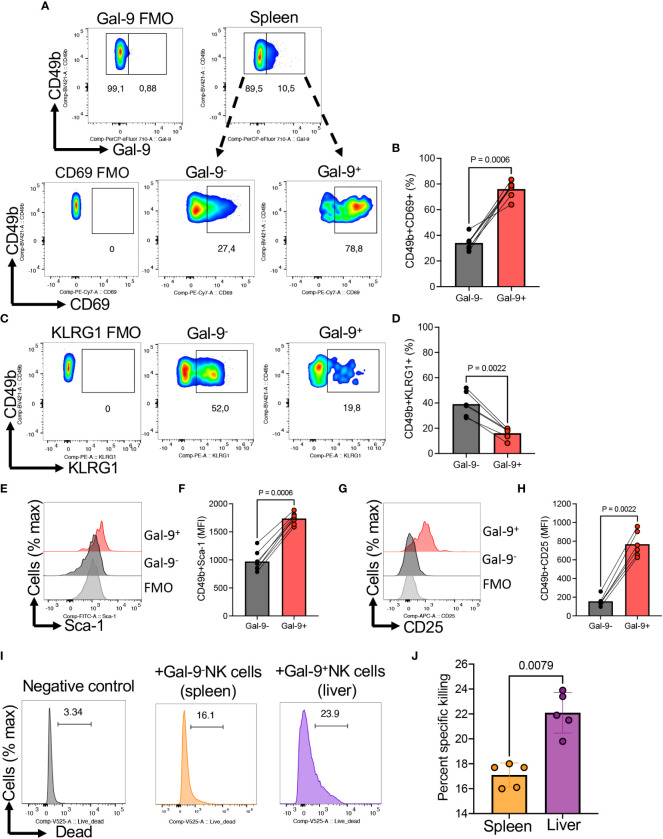
The expression of CD69, KLRG-1, Sca-1, and CD25 in Gal-9+NK cells. (A) Representative flow cytometry plots, and (B) cumulative data of percentages of CD69 expressing NK cells among Gal-9- or Gal-9+ NK cells of BALB/c mice. (C) Representative flow cytometry plots, and (D) cumulative data of percentages of KLRG1 expressing NK cells among Gal-9- or Gal-9+ NK cells of BALB/c mice. (E) Representative flow cytometry plots, and (F) cumulative data of the intensity of Sca-1 expression among Gal-9- or Gal-9+ NK cells of BALB/c mice. (G) Representative flow cytometry plots, and (H) cumulative data of the intensity of CD25 expression among Gal-9- (splenocytes) or Gal-9+ (liver cells) NK cells of BALB/c mice. (I) Representative plots, and (J) cumulative data of percent specific killing of target cells (RMA-s cells) in the presence and absence of Gal-9+NK cells in splenocytes of mice. Each dot represents data from an animal, mean ± SEM from multiple independent experiments. The mean fluorescence intensity (MFI). Fluorescence minus one (FMO).

