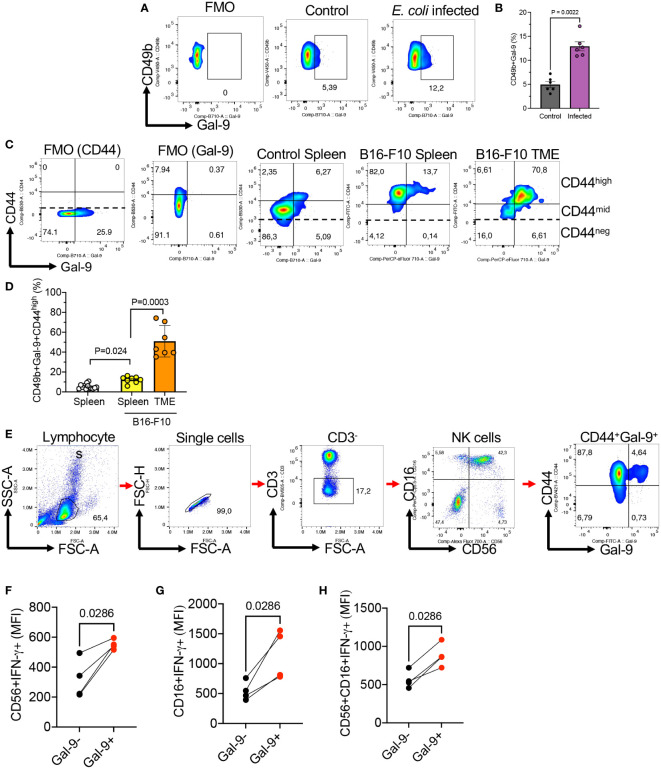
Figure 6.
The expansion of Gal-9+NK cells in the spleen and tumor tissues of B16-F10 melanoma model and the expansion of Gal-9+NK cells in COVID-19 patients. (A) Representative flow cytometry plots, and (B) cumulative data of the frequency of NK cells in the spleen of control or infected adult mice with E. coli 48 hr post-infection. Each dot represents data from an animal. (C) Representative flow cytometry plots showing the co-expression of CD44 and Gal-9 in NK cells from the spleen of tumor naïve or the spleen and tumor microenvironment (TME) of tumor bearing mice (B16-F10 melanoma). (D) Cumulative data of the percentages of Gal-9+NK cells in the spleen of tumor naïve or the spleen and TME of tumor-bearing mice. (E) Representative gating strategy for human Gal-9+NK cells. (F) Cumulative data of IFN-γ expression in Gal-9+ and Gal-9- NK cells among CD56+CD16-, (G) CD16+CD56-, and (H) CD16+CD56+ subset of human NK cells. Each dot represents data from an animal or human study subject. The mean fluorescence intensity (MFI).

