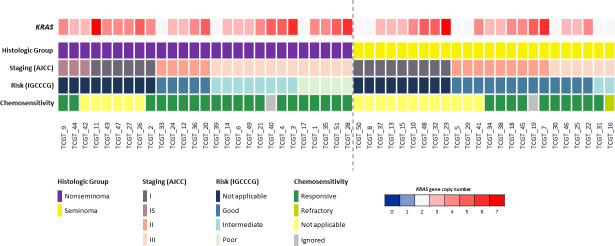
Figure 1.
Copy number variations of the KRAS gene compared to clinicopathologic data (histological group, staging, risk and chemosensitivity). Only TGCTs evaluated for copy number variation are presented (n = 51). Each column represents an individual patient. The dotted line in the center of the figure separates seminoma and non-seminoma cases. A color scale (blue to red) is used to represent the variation in the number of copies of the KRAS gene, in which the dark blue color represents the deletion of two copies of this gene (0 copies); light blue the deletion of only one copy; white represents that there is no loss or gain of copies; and light red to dark red colors represent a gain of copies of this gene (1 to 7 copies).

