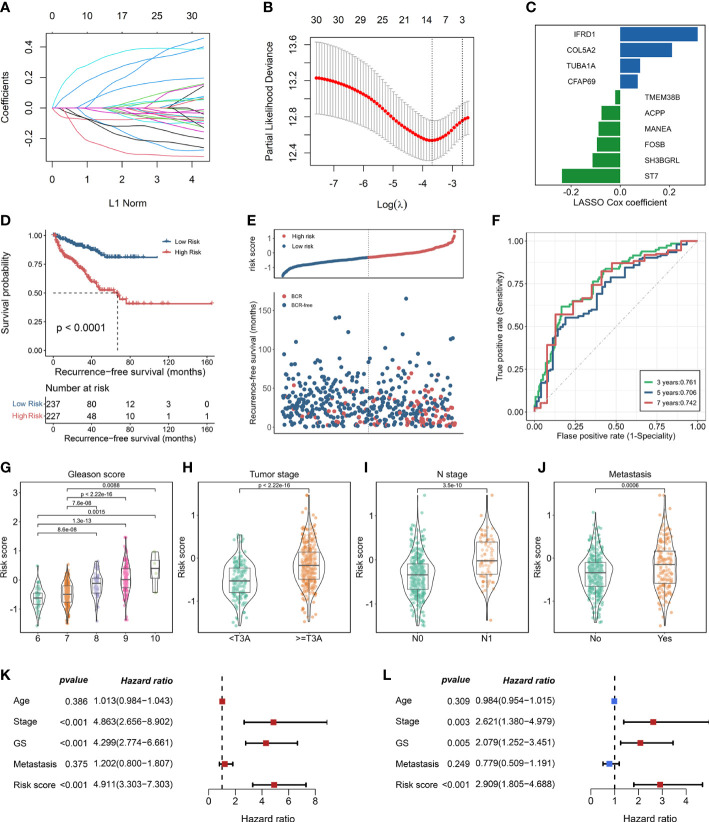
Figure 3.
Construction of enzalutamide-induced signature and its clinical relevance. (A) Lasso cox regression coefficients of 31 candidate genes. (B) Partial likelihood deviance of candidate genes derived from lasso Cox regression analysis with 10-fold cross-validation. Two vertical dotted lines represent minimum mean cross-validation error and one standard error of the minimum, respectively. (C) The coefficients of 10 genes selected from lasso Cox regression model. (D) Kaplan–Meier curve in terms of RFS for high-risk and low-risk patients divided by enzalutamide-induced signature. (E) The risk score and recurrence-free survival status based on TCGA-PRAD cohort. (F) The receiver operating characteristics curve for the prediction of 3-, 5-, and 7-year RFS based on the risk score derived from enzalutamide-induced signature. The abundance of risk score calculated by enzalutamide-induced signature in different clinicopathological characteristics, including Gleason score (G), tumor stage (H), N stage (I), and metastasis status (J). Univariate Cox regression analysis (K) and multivariate Cox regression analysis (L) for enzalutamide-induced signature and clinical variables, including age, stage, Gleason score, and metastasis status.

