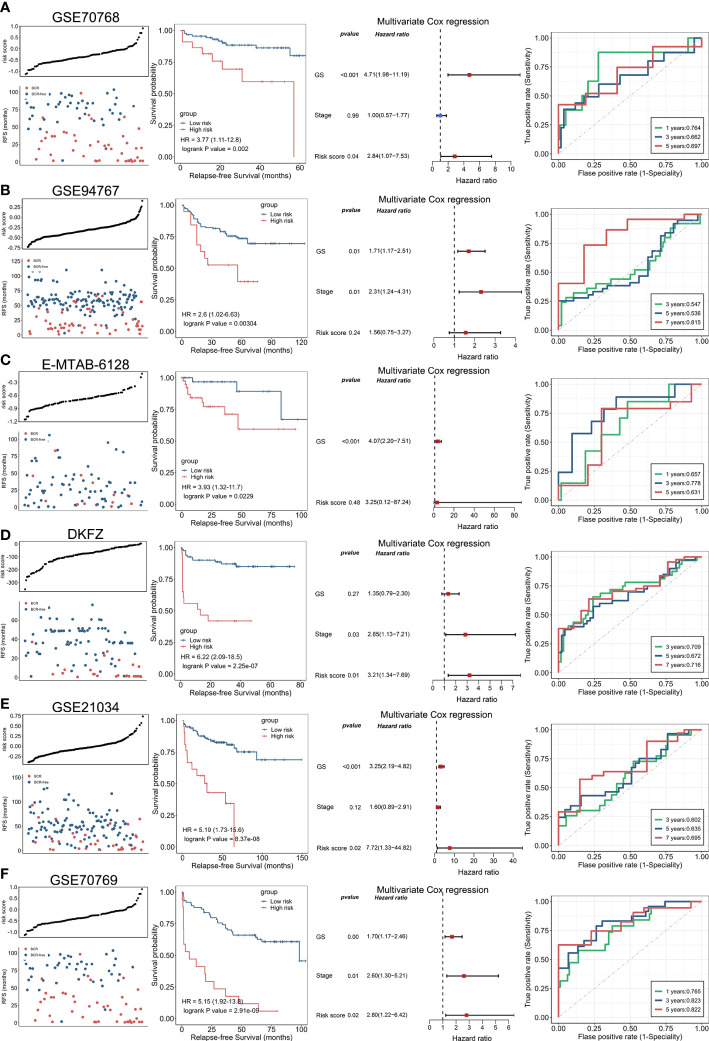
Figure 4.
Validation of enzalutamide-induced signature in independent cohort. The plot of risk score and RFS status, Kaplan–Meier curve, multivariate Cox regression analysis, and receiver operating characteristics curve for evaluating the predicting ability of enzalutamide-induced signature in GSE70768 (A), GSE94767 (B), E-MTAB-6128 (C), DFKZ (D), GSE21034 (E), and GSE70769 (F) cohorts, respectively.

