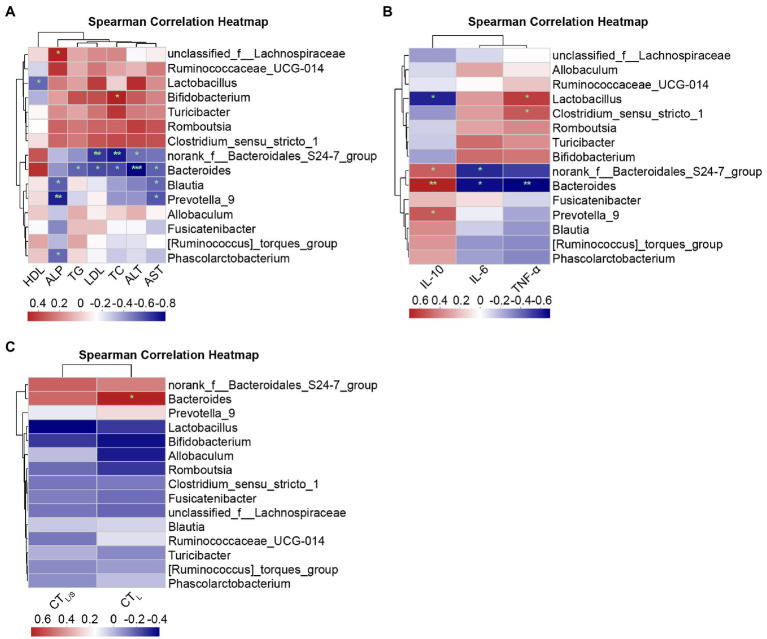
Figure 10.
Spearman correlation heatmaps at the genus level. (A) Correlation heatmap of the serum lipid metabolism parameters ALT, AST, ALP, TC, TG, HDL, and LDL with the intestinal microbiota. (B) Correlation heatmap of the inflammatory factors IL-6, TNF-α, and IL-10 with the intestinal microbiota. (C) Correlation heatmap of the hepatic steatosis indicators CTL and CTL/S with the intestinal microbiota. Red indicates a positive correlation, and blue indicates a negative correlation; the darker the color, the higher the correlation. Significant threshold: *p < 0.05, **p < 0.01, ***p < 0.001.

