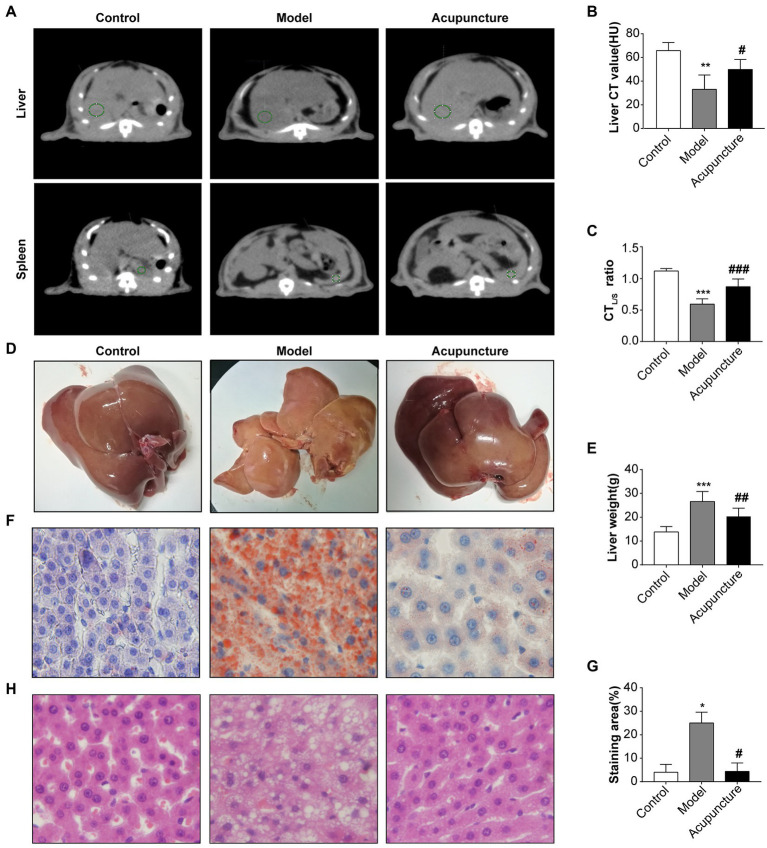
Figure 3.
Impact of acupuncture on hepatic steatosis in non-alcoholic fatty liver disease (NAFLD) rats. (A) Liver and spleen CT value measurements of liver fat content. QCT films of the liver and spleen of the control, model, and acupuncture groups; green circles indicate regions of interest (ROI) in liver and spleen measurements used to indicate the CT values of the liver and spleen. (B) Liver CT (CTL) values (HU). (C) Liver to spleen CT ratio (CTL/S). (D) Fresh liver tissues. (E) Liver weight (g). (F) Oil Red O staining of rat livers (×100). (G) Quantification of the red area/total area by Oil Red O staining. (H) H&E staining of liver tissue (×100). Data are shown as mean ± SD. *p < 0.05, ***p < 0.001, Control vs. Model, #p < 0.05, ##p < 0.01, Model vs. Acupuncture.

