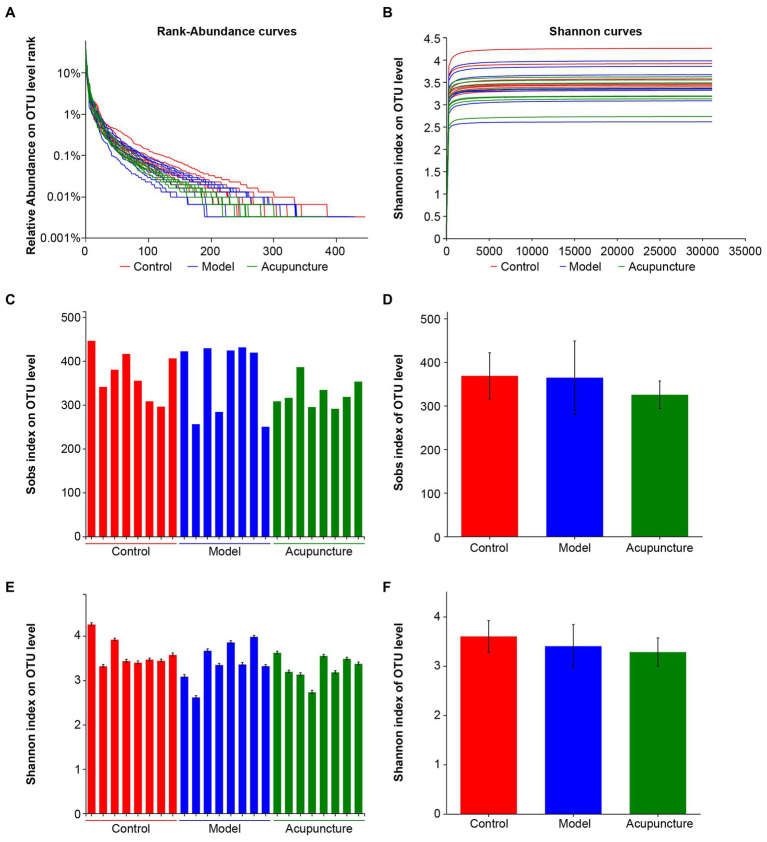
Figure 4.
Sample sequencing results and species diversity analysis. (A) Rank-abundance curves indicating species diversity, including richness and evenness. Species richness is represented by the width of the curve. The larger the curve range on the horizontal axis, the higher the species richness; the smoother the curve, the more community evenness. (B) Rarefaction curve of Shannon index at the OTU level. (C) Alpha diversity of Sobs index at the OTU level indicating community richness. (D) Statistical analysis of the Sobs index at the OTU level. (E) Alpha diversity of the Shannon index at the OTU level indicating community diversity. (F) Statistical analysis of the Shannon index at the OTU level.

