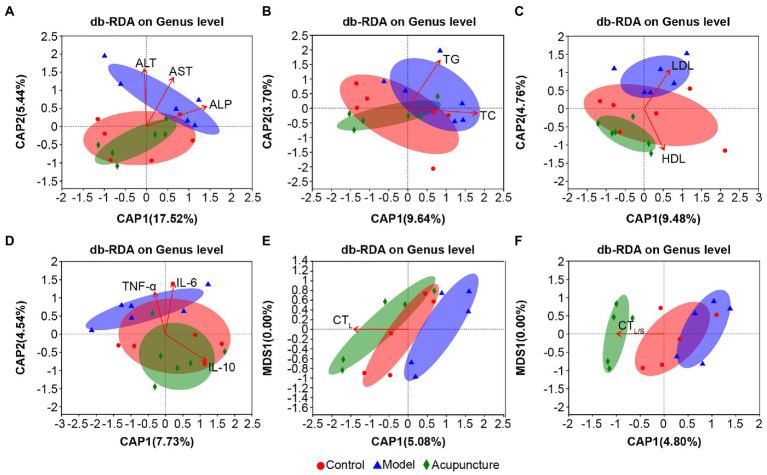
Figure 8.
Distance-based redundancy analysis (db-RDA) on genus level of lipid metabolism parameters, inflammatory factors, and hepatic steatosis with intestinal microbiota. (A) Serum ALT, AST, and ALP. (B) Serum TC and TG. (C) Serum HDL and LDL. (D) Serum IL-6, TNF-α, and IL-10. (E) Liver CT (CTL) values. (F) CT values of liver to spleen ratio (CTL/S). The length of the red arrows represents the degree of the effect of serum lipid metabolism parameters, inflammation factors, and hepatic steatosis on the intestinal microbiota. The longer the arrow, the greater the correlation.

