Figure 3.
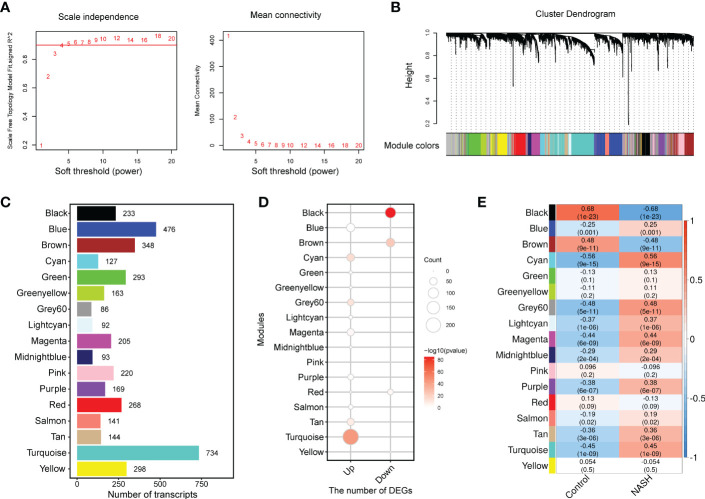
WGCNA network and module identification. (A) Soft-thresholding calculation of MergeCohort. The left panel displays the scale-free fit index versus soft-thresholding power. The right panel shows the mean connectivity versus soft-thresholding power. Power 5 was selected, for which the fit index curve flattens out upon reaching a high value (> 0.9). (B) The Cluster dendrogram of co-expression network modules from WGCNA depending on a dissimilarity measure (1-TOM). The leaves in the tree represent genes and the colors in the horizontal bar indicate co-expression module determined by the dynamic tree cut algorithm. (C) Number of genes in each module. (D) Enrichment of upregulated and downregulated DEGs in each module. (E) Heatmap showing the association between module eigengenes (rows) and NASH disease status (column). Associated p values were computed using the cor.test R function. The color scale in the heat map represents the magnitude of the Pearson correlation coefficients. Number in each cell contained corresponding correlation coefficient and p value (in brackets). WGCNA, weighted gene correlation network analysis; TOM, topological overlap matrix.

