Figure 4.
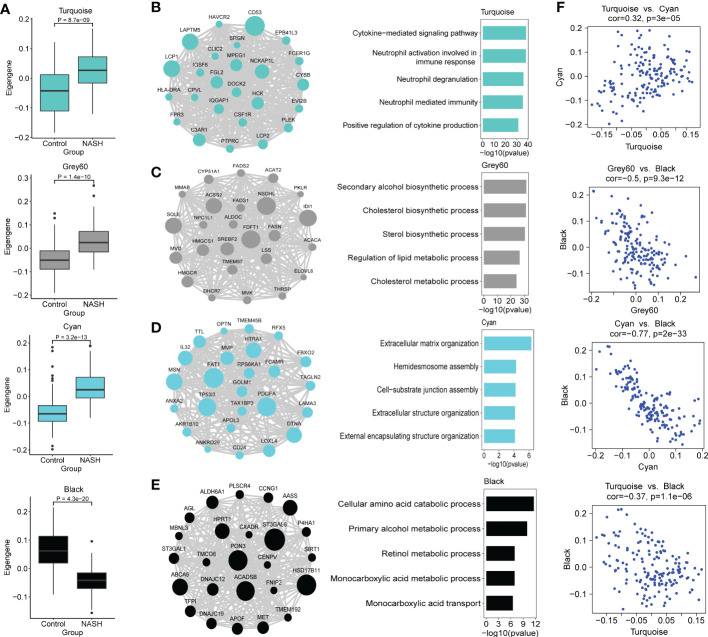
Functional characterization of co-expression modules of interest identified by WGCNA. (A) Box and Whisker plots representing the expression of module eigengenes Turquoise, Grey60, Cyan, Black between NASH (n = 97) and healthy control (n = 67) samples. Data are presented as median with first and third quartiles as the box edges. Differences between group were estimated by Student’s t test. (B–E) The network of hub genes (module genes within the top 25 genes with the highest intromodular connectivity values (kWithin)) (left panel) and top GO terms (right panel) of the modules Turquoise (B), Grey60 (C), Cyan (D) and Black (E) are shown. In the network diagrams, node sizes correspond to kWithin in the module. For the bars plot, the bars in the GO enrichment results represent the -log10(pvalue). (F) Scatterplots of module eigengenes show positive correlation between Turquoise and Cyan, and negative correlation between Grey60, Cyan, Turquoise and Black, respectively.

