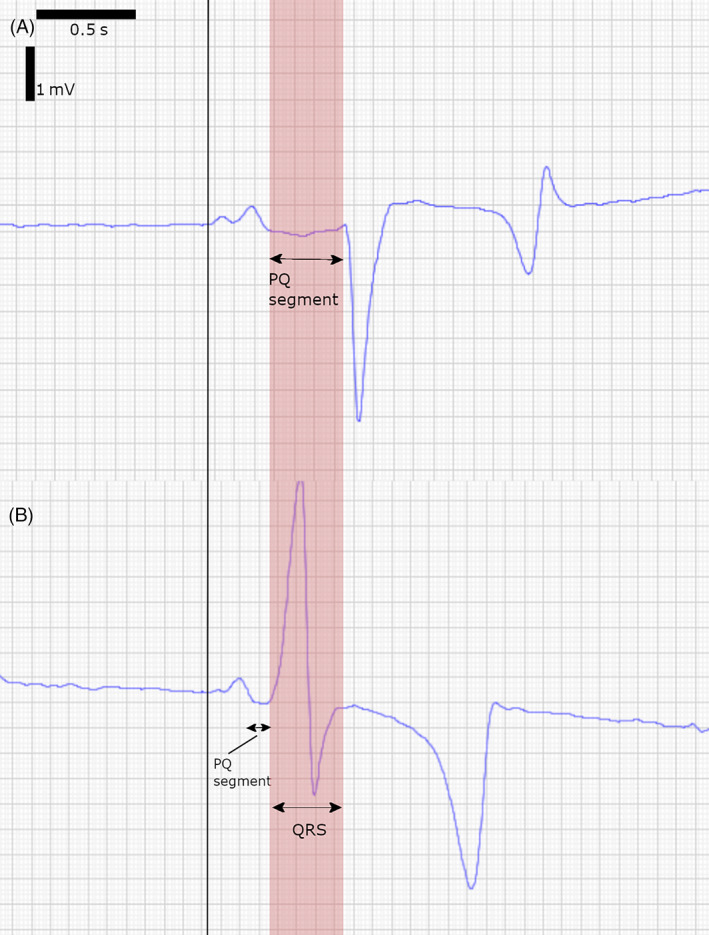
FIGURE 1.

Comparison of a normal (A) and pre‐excitation (B) complex from a modified base‐apex electrocardiogram taken 5 s apart at a constant heart rate of 40 bpm. The black vertical line indicates the start of the P wave in both complexes. The red area indicates the PQ segment of the normal complex and how it relates to the pre‐excited QRS. (A) For the sinus beat, the PQ segment is 124 ms and QRS duration is 129 ms. (B) During pre‐excitation, the PQ segment is very short and immediately followed by the pre‐excited QRS complex, which is widened (201 ms) and shows a different morphology. A delta wave can be identified as a reduced dV/dt in the initial portion of the widened QRS complex. Comparison of both traces shows that during pre‐excitation, the entire pre‐excited ventricular depolarization is completed before the normal AV conduction reaches the ventricle.
