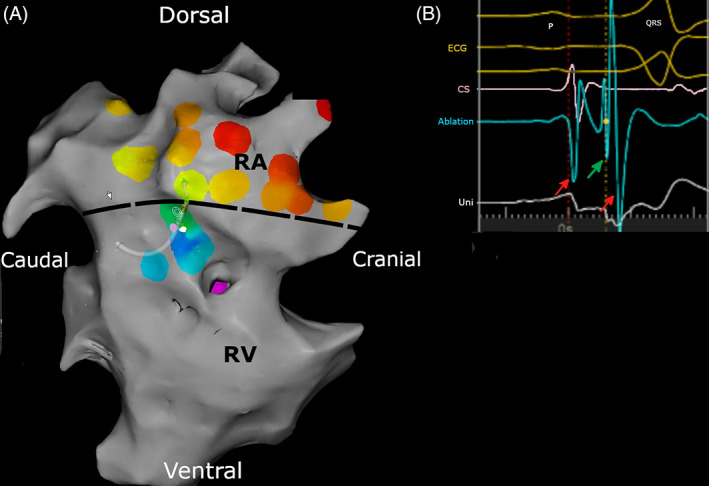
FIGURE 3.

(A) Activation map of the right atrium (RA) and right ventricle (RV). Only a small part of the 3D anatomy (gray) has been created and only a few activation points (color) have been registered because the accessory pathway was quickly found. The color varies following the rainbow spectrum from red (earliest activation) to purple (latest activation) in relation to the electrograms from the coronary sinus, which served as a timing reference. The map demonstrates the earliest ventricular activation in continuation with atrial activation, which defines the ventricular insertion of the accessory pathway, located at the right cranial free wall between the right atrium and right ventricle. The dotted line indicates the demarcation between RA and RV. (B) Surface electrocardiogram (yellow traces), electrogram from the coronary sinus (CS) catheter (pink traces), recording from the ablation catheter at the accessory pathway (light blue trace) and unipolar recording from the ablation catheter (white trace), recorded at the same timing and catheter position as Figure 3A. The accessory pathway potential can be recognized as the sharp spike (green arrow) between the atrial (first red arrow) and ventricular (second red arrow) electrogram.
