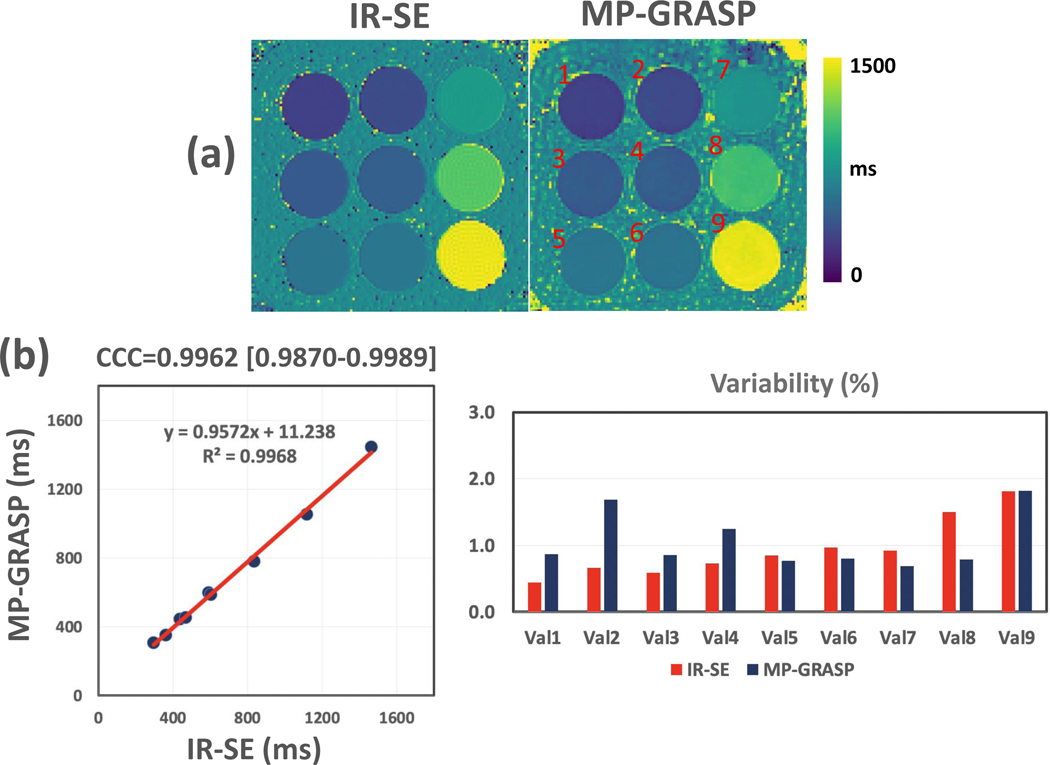
Figure 5.
(a) Comparison of one slice of T1 map estimated from IR-SE and MP-GRASP imaging. (b) The linear correlation shows a strong correlation between the mean T1 values estimated from the two methods, and the Lin’s CCC was 0.9962 (95% confidence interval= 0.9870 to 0.9989). The variability of T1 estimation over all the 12 scans is good (below 2% for all phantom vials) for both IR-SE and MP-GRASP.

