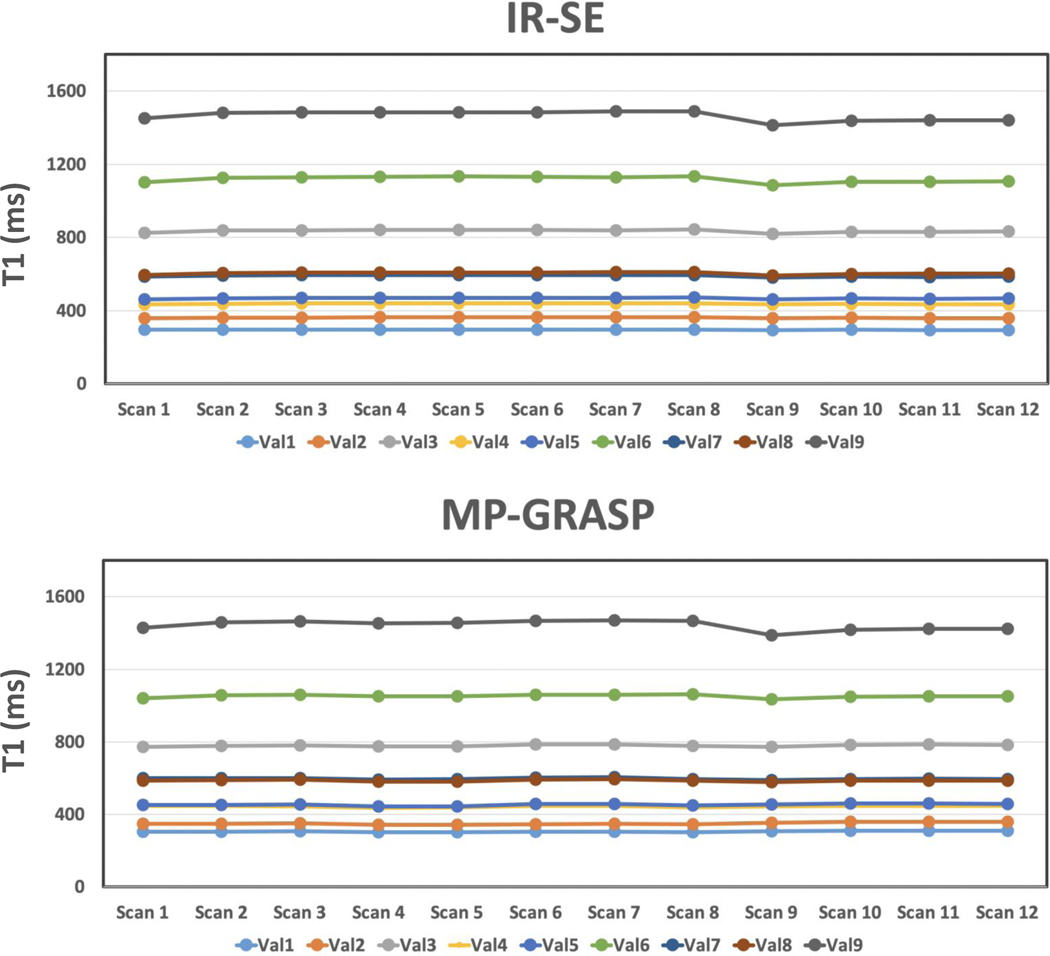
Figure 6.
Comparison of mean T1 values estimated from each phantom vial from MP-GRASP and IR-SE imaging performed in two settings. In the first setting, MR scans started 3 hours after the phantom was put into the scanner. MP-GRASP and IR-SE were alternatively scanned for a total of 8 times each (referred to as Scan 1 to Scan 8). In the second setting, MRI scans started right after the phantom was put into the scanner, and MP-GRASP and IR-SE were alternatively scanned for a total of 4 times each (referred to as Scan 9 to Scan 12). For each setting, the T1 estimation is repeatable. However, for vials with larger T1 values (e.g., vial 7 to vial 9), there is a jump of measured T1 value from the first scan (Scan 1 and Scan 9) to the rest, which is potentially due to adjustment of temperature in the beginning, and this trend was observed both in the IR-SE and the MP-GRASP results. In addition, potentially due to fluctuation of scanner room temperature in different days, the T1 values estimated in the second setting are generally lower compared to that from the first setting, and this was also observed both in the IR-SE and the MP-GRASP results.

