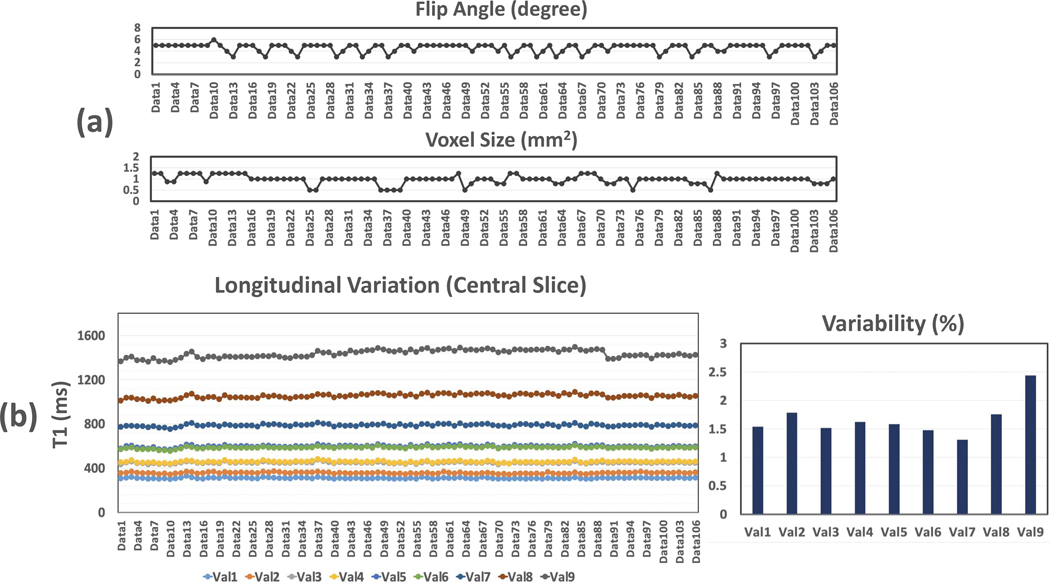
Figure 7.
The longitudinal variations of mean T1 values over all the 106 datasets for a central slice of T1 map, along with corresponding variation of flip angle and voxel size. Similar results for the peripheral slice are shown in Supporting Information Figure S1. Different line colors indicate different phantom vials. The longitudinal repeatability of T1 estimation is also shown in the figure. The variation of T1 measurement was below 2% for vials 1–8, and it was slightly larger for vial 9, which is still below 2.5%. For phantom vial 8 and vial 9, there is slight increase and then decrease of mean T1 values along time, which is consistent with the trend observed in Figure 6.

