
Fig. 1.
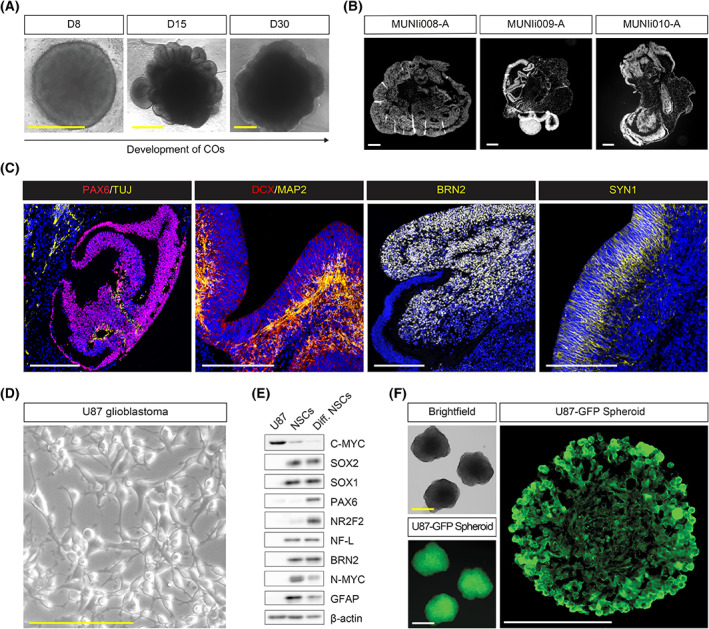
Characterization of cerebral organoids and U87 glioblastoma cell line. (A) Representative brightfield microscopy images showing the morphology of developing cerebral organoids (COs) at day 8 (D8), day 15 (D15), and day 30 (D30). Scale bar = 500 μm; n = 3. (B) Hoechst‐stained paraffin sections of representative images of COs derived from MUNIi008‐A, MUNIi009‐A, and MUNIi010‐A iPS cell lines showing their internal organoid organization at D55. Scale bar = 200 μm; n = 3. (C) Representative IHC staining images of COs showing the localization of neuronal (TUJ, MAP2, DCX, BRN2, and SYN1) and neural progenitor (PAX6) markers. Scale bar = 200 μm; n = 3. (D) Representative brightfield microscopy image of U87 glioblastoma cell line. Scale bar = 200 μm; n = 3. (E) Western blotting analysis of neuronal, glial, and neural stem/progenitor markers in U87, self‐renewing neural stem cells (NSCs), and differentiated NSCs. ß‐actin serves as loading control; n = 3. (F) Representative brightfield (top left) and fluorescent (bottom left) microscopy images of U87 spheroids used for coculture experiments and representative GFP+ image of U87 spheroid section (right). Scale bar = 200 μm; n = 3.