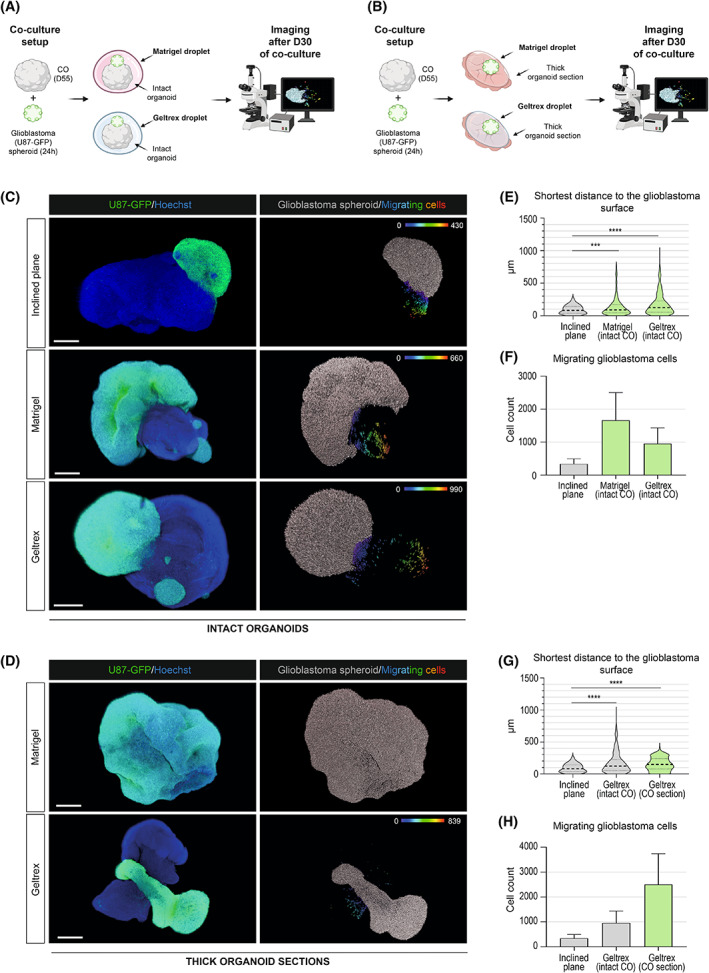
Fig. 3.

Coculture with ECM proteins enhances the growth and migration of glioblastoma. A scheme showing the pipeline of glioblastoma‐cerebral organoid (GLICO) coculture using intact 55‐day‐old organoids (A) or thick (250 μm) sections of cerebral organoids (COs) (B). 24‐h‐old glioblastoma spheroid (U87) was transferred to the vicinity of a single 55‐day‐old mature or thick (250 μm) section of COs. GLICO coculture was supported by embedding in a droplet of Matrigel™ or Geltrex™ at 37 °C for 10 min. GLICO was transferred into nonadherent cell culture dishes and cultured on an orbital shaker under standard CO cell culture conditions. Image acquisition and analysis were performed after 30 days of GLICO coculture. Images of cleared whole‐mount GLICO tissues after 30 days of coculture based on intact CO (C) or thick (250 μm) sections of COs (D) using Matrigel™ or Geltrex™. The left images show a fluorescently labeled glioblastoma spheroid (green) and glioblastoma/CO nuclei (blue). The right images visualize individual glioblastoma cells – glioblastoma spheroid (gray) and cells migrated from the glioblastoma spheroid (pseudocolor). In the case of Matrigel on organoid sections depicted in (F), the growth of glioblastoma increased to such an extent that it was impossible to evaluate the cell migration after 30 days. A spectrum of colors corresponds to the shortest distance of individual migrating cells to the delineated glioblastoma spheroid/CO border (μm). Scale bar = 500 μm. Three independent coculture experiments were used for the analysis with three GLICOs analyzed per each condition. (E, G) Violin plots showing the mean shortest migration distance (μm) of glioblastoma migrating cells to glioblastoma spheroid surface. Median distance with Matrigel in intact organoid = 89 μm, Q1 = 42.7 μm, Q3 = 171 μm; median distance with Geltrex in intact organoid = 123 μm, Q1 = 52.8 μm, Q3 = 227 μm; median distance with Geltrex in a thick section = 148 μm, Q1 = 78 μm, Q3 = 239 μm. ***P < 0.0005, ****P < 0.0001 by unpaired t‐test. (F, H) Bar graphs showing the total count of cells migrating from the glioblastoma spheroid. Mean cell count with Matrigel in intact organoid = 1661 migrating cells, Mean cell count with Geltrex in intact organoid = 954 migrating cells, Mean cell count with Geltrex in a thick section = 2505 migrating cells. Error bars represent the standard error of the mean. The analysis in (D, E) and (G, H) compare the use of Matrigel™ and Geltrex™ against an inclined plane on day 30 (shown in Fig. 2). Data were collected from three independent experiments.
