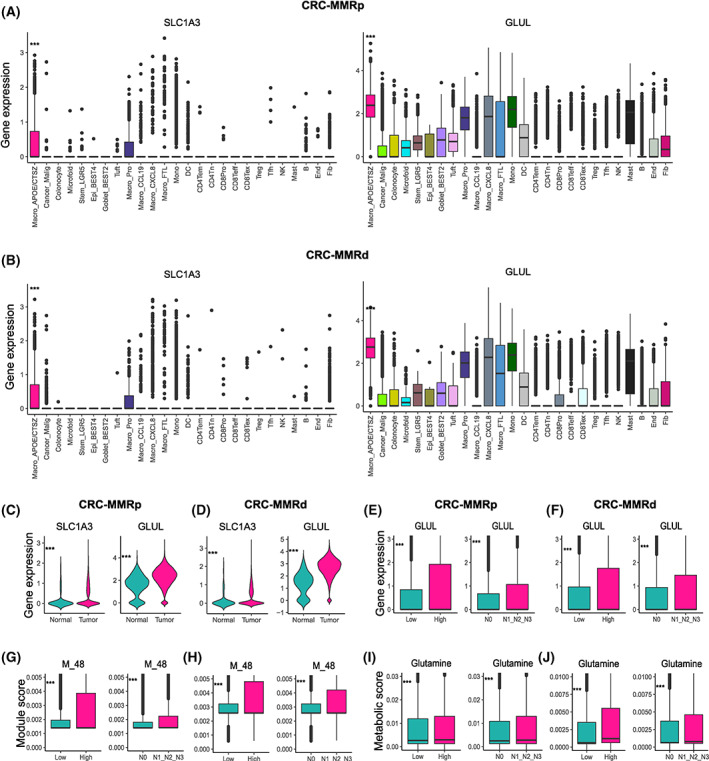
Fig. 4.

APOE+CTSZ+TAM upregulated GLUL and glutamate‐to‐glutamine metabolic flux. (A, B) SLC1A3 and GLUL expression among cell subtypes in CRC‐MMRp samples (A) and CRC‐MMRd samples (B). ***P < 0.001, Kruskal–Wallis test. The mean gene expression is marked in the bar graph and vertical lines indicate the maximum and minimum values of the gene expression. (C, D) SLC1A3 and GLUL expression in macrophage divided from tumor and normal samples in CRC‐MMRp samples (n = 29 in tumor samples, n = 29 in normal samples) (C) and CRC‐MMRd samples (n = 35 in tumor samples, n = 35 in normal samples) (D). (E, F) GLUL expression among different histologic grade samples and node status in CRC‐MMRp samples (E) and CRC‐MMRd samples (F). (G, H) M_48 score among different histologic grade samples and node status in CRC‐MMRp samples (G) and CRC‐MMRd samples (H). (I, J) Glutamine accumulation value among different histologic grade samples and node status in CRC‐MMRp samples (I) and CRC‐MMRd samples (J). ***P < 0.001, unpaired one‐sided Wilcoxon test. CRC‐MMRp tumor sample (n = 29), CRC‐MMRd sample (n = 35), high‐grade CRC‐MMRp tumor sample (n = 4), low‐grade CRC‐MMRp tumor sample (n = 25), high‐grade CRC‐MMRd tumor sample (n = 9), low‐grade CRC‐MMRd tumor sample (n = 26), N0 CRC‐MMRp tumor sample (n = 12), N1&2&3‐grade CRC‐MMRp tumor sample (n = 17), N0 CRC‐MMRd tumor sample (n = 23), and N1&2&3‐grade CRC‐MMRd tumor sample (n = 12). Mono, monocyte; DC, dendritic cell; NK, natural killer; Tfh, follicular helper T cell; Fib, fibroblast; End, endothelial cell; B, B cell; Mye, myeloid cells; Epi, epithelial cells.
