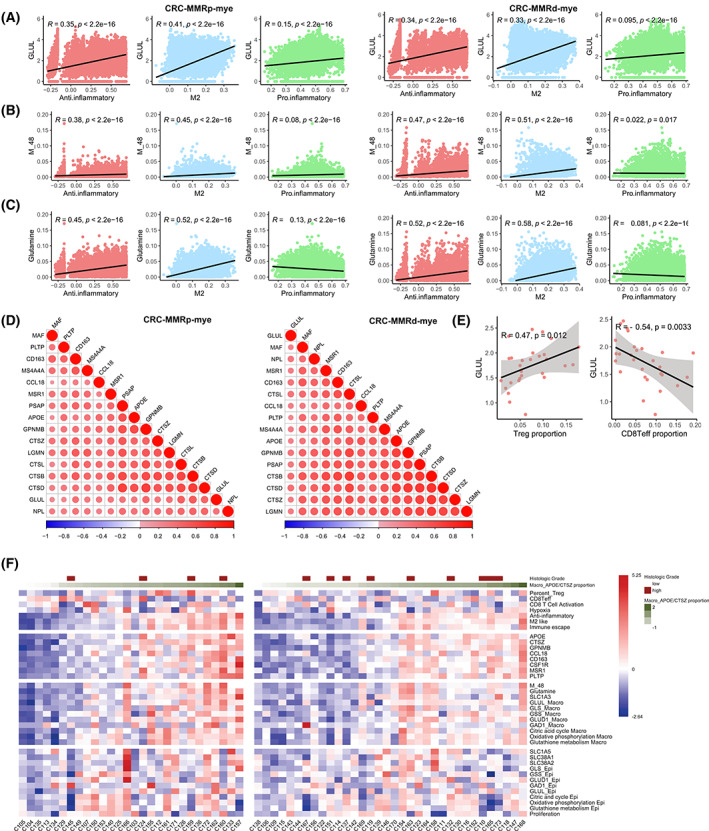
Fig. 5.

The relevance between metabolism and cell function in macrophages. (A–C) The correlation among GLUL expression (A), M_48 score (B), and glutamine accumulation value (C) with anti‐inflammatory, M2, and proinflammatory score in CRC‐MMRp samples and CRC‐MMRd samples. (D) The expression correlation between GLUL with genes in anti‐inflammatory in CRC‐MMRp samples and CRC‐MMRd samples. (E) Scatterplot showing the Spearman correlation of the GLUL gene expression and infiltration proportion of Treg or CD8+ T effector cells (divided by the total T/NK cell number) in tumor tissues of CRC‐MMRp samples. CRC‐MMRp tumor sample (n = 29) and CRC‐MMRd sample (n = 35). (F) Molecular characteristics of different cell types across samples in CRC‐MMRp (left) and CRC‐MMRd patients (right).
