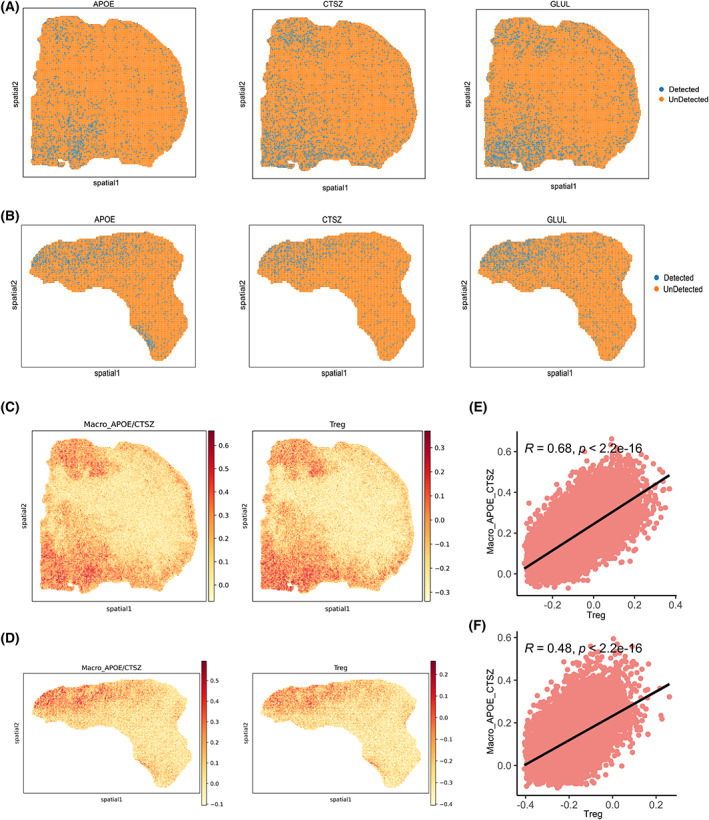
Fig. 6.

Colocalization of APOE+CTSZ+TAM with cells expressing GLUL as well as Treg revealed by spatial transcriptomics. (A, B) Spatial feature plots of gene expression of APOE, CTSZ, and GLUL in patients 19 (A) and 36 (B). (C, D) Spatial feature plots of signature score of APOE+CTSZ+TAM and Treg in tissue sections in patients 19 (C) and 36 (D). (E, F) Spearman correlation of signature score of APOE+CTSZ+TAM (y‐axis) and Treg (x‐axis) in patients 19 (E) and 36 (F).
