Fig. 7.

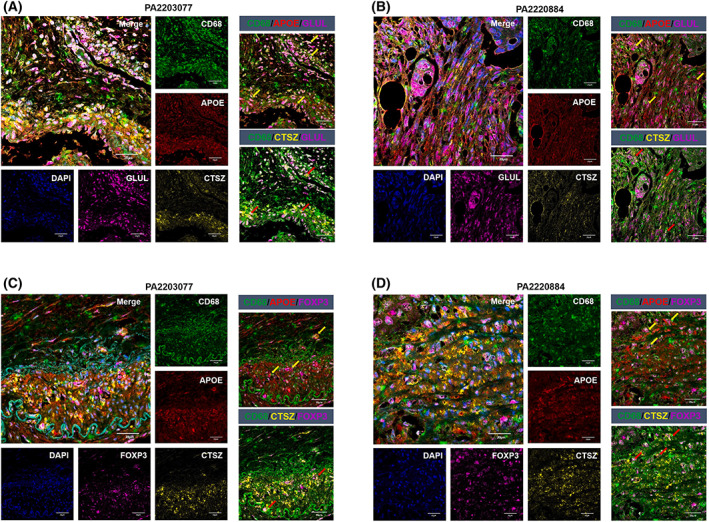
Tissue and cellular distribution of APOE+CTSZ+TAM, GLUL+ cells, and Treg. (A, B) Multiplex immunofluorescence staining of CD68 (green), APOE (red), CTSZ (yellow), GLUL (purple), and DAPI (blue) on CRC tissue section of patient PA2203077 and patient PA2220884, scale bar 20 μm. Left: merged and single‐channel photo of the tissue section. Right: combined channel of CD68/APOE/GLUL and CD68/CTSZ/GLUL on the tissue section. (C, D) Multiplex immunofluorescence staining of CD68 (green), APOE (red), CTSZ (yellow), FOXP3 (purple), and DAPI (blue) on CRC tissue section of patient PA2203077 and patient PA2220884, scale bar 20 μm. Left: Merged and single‐channel photo of the tissue section. Right: Combined channel of CD68/APOE/FOXP3 and CD68/CTSZ/FOXP3 on the tissue section. Arrows indicate the representative regions with three immunofluorescence staining.
