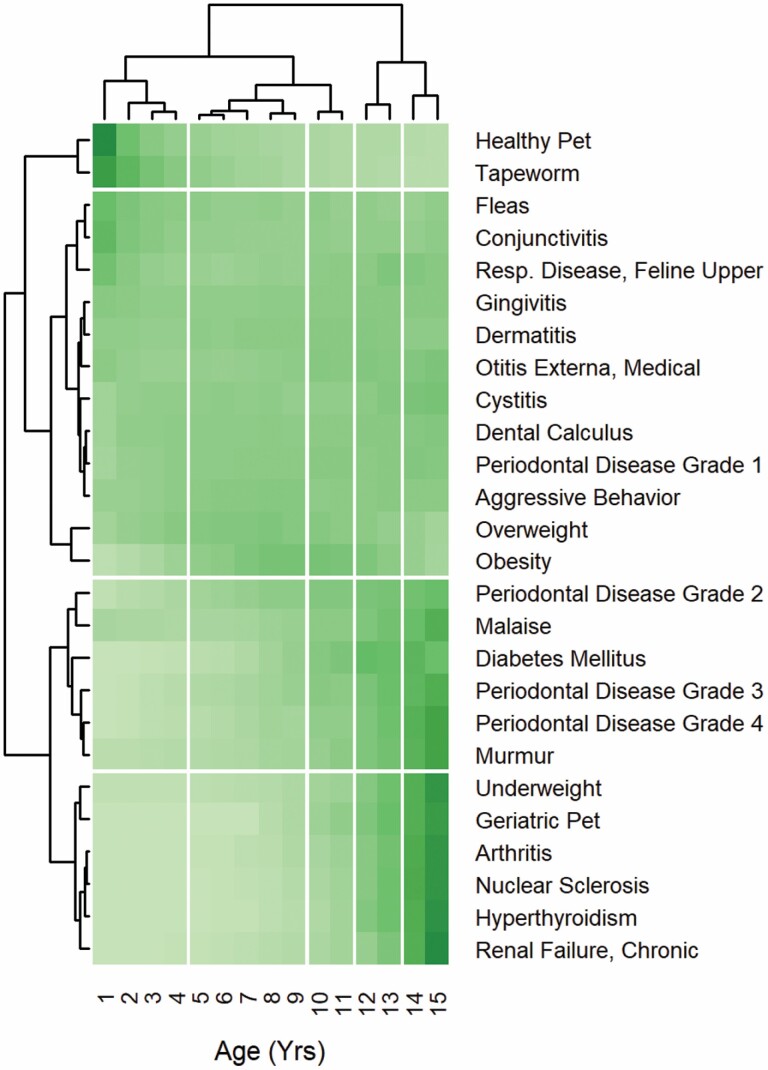
Figure 2.
Diagram illustrating results produced by the bi-clustering and adaptive branch-pruning algorithms for cat (using the final values of “diagnosis threshold” and “age deep split”). Cells are colored to show the (scaled) count of diagnoses per pet-year with darker shading indicating higher values. Clusters identified by the adaptive branch-pruning algorithm are separated from neighboring clusters by white lines.

