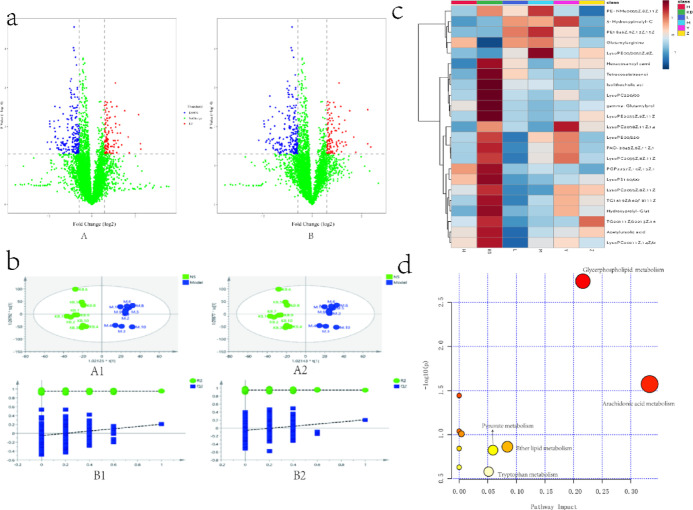
Figure 4.
Multivariate statistical analysis of metabolites of rat samples. (a) Volcano plot analysis between the control group and model group (A: positive; B: negative); (b) multivariate statistical analysis of metabolomic data (A1: OPLS-DA score plot (positive); A2: OPLS-DA score plot (negative); B1: cross validation (positive); B2: cross validation (negative)); (c) cluster analysis of RA markers; and (d) metabolic pathway analysis of common markers.

