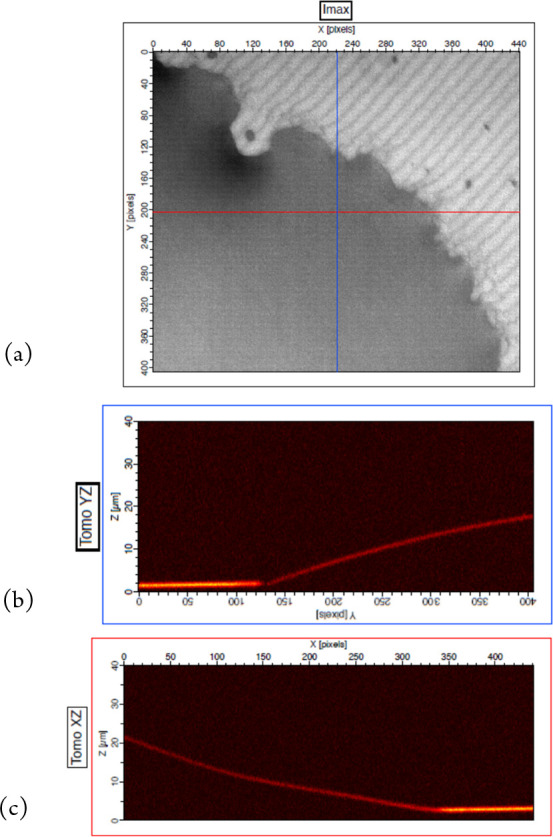
Figure 12.

Measurement results of an automated dispenser system on a microdroplet of oil: (a) reflection image (Imax) showing a droplet on the left and substrate on the top right, (b) tomographic image (YZ) from the blue line in (a), and (c) tomographic image (XZ) from the red line in (a).
