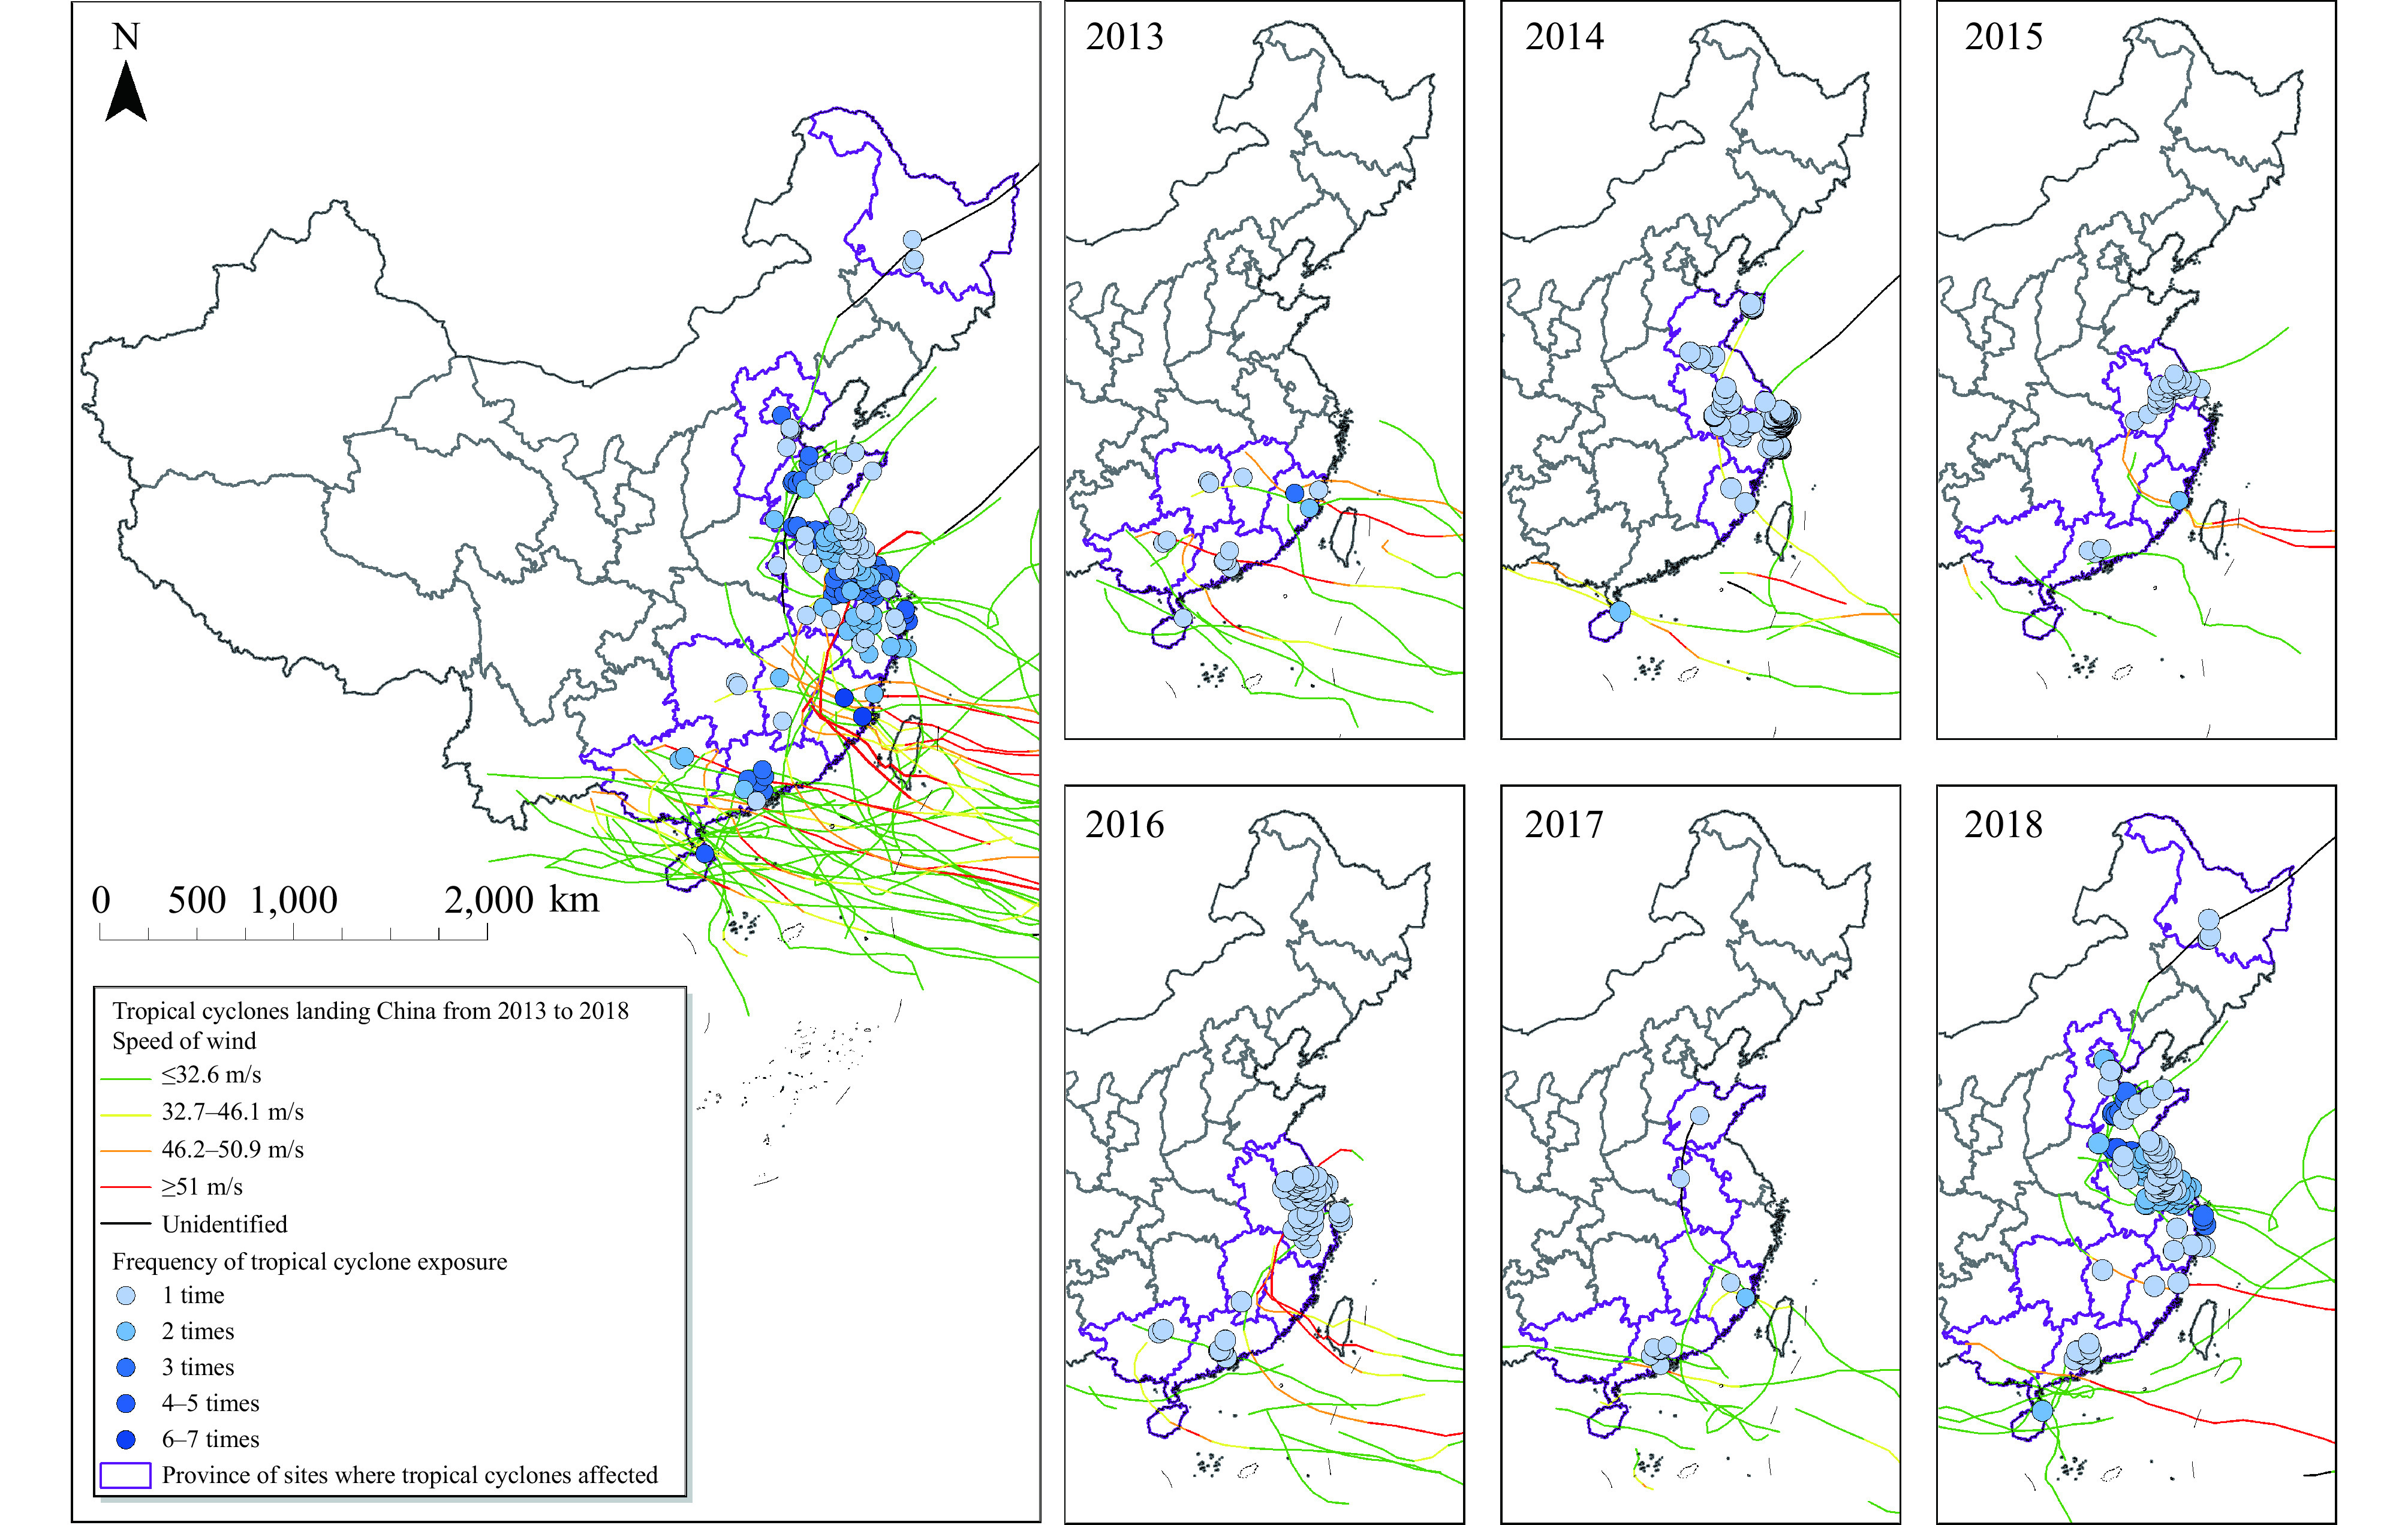
Figure 1.

Spatial distribution of 153 eastern Chinese counties (blue circles) that were exposed to at least one tropical cyclone over the study period (2013–2018).
Note: Curves show the tracks of the 46 tropical cyclones that made landfall on China continent in this period; color of storm tracks denotes the maximum wind speed. Color of the circle in each county indicates the frequency of tropical cyclone exposures during the study period.
