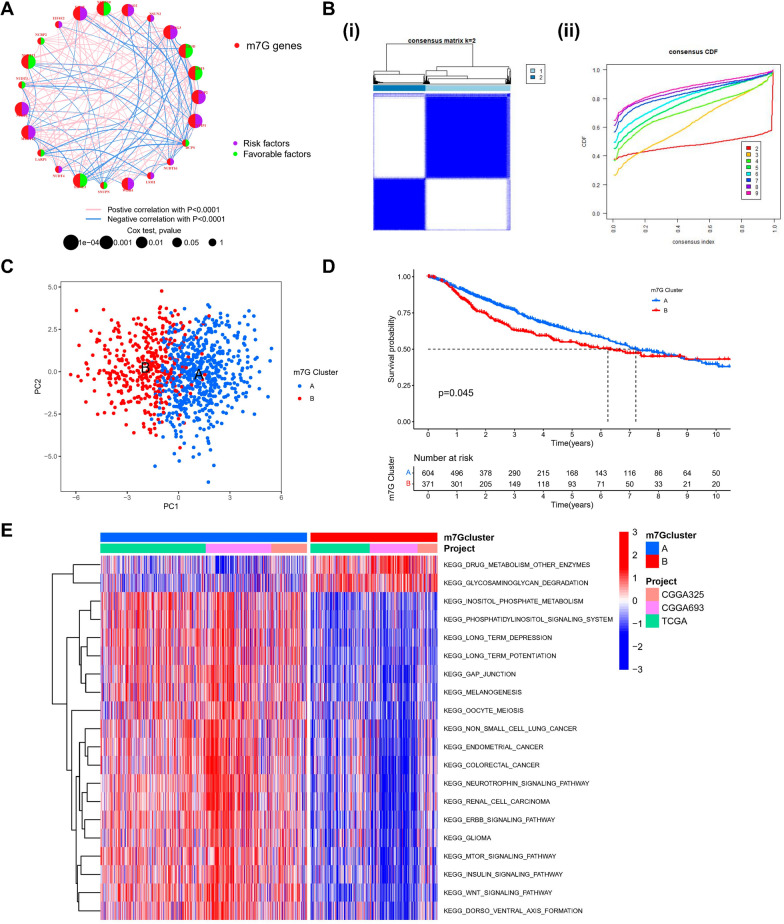
Fig. 2.
Identification of m7G methylation modification profiles. A The m7G regulators interactions in LGG. The diameter of the circle indicated the significance level of the P values obtained from the Log-rank test, which were, successively, p < 1e-04, p < 0.001, p < 0.01, p < 0.05, and p < 1. Risk factors are denoted in purple, whereas favorable factors for overall survival are denoted in green. The connecting lines show relationships of m7G regulators as determined by Spearman correlation analysis. Pink represents a positive correlation and blue represents a negative correlation. B (i) The consensus matrix for k = 2 produced using consensus clustering is shown by the heatmap. (ii) Relative change in consensus CDF area under the curve for k = 2 to 9. C Two m7G modification subtypes’ transcriptome profiles underwent principal component analysis, revealing a significant variation in modification patterns. D Kaplan–Meier curves with Log-rank p values < 0.05 demonstrated a significant variation in survival between the two m7G modification patterns. These analyses were based on the TCGA-LGG, CGGA-325, and CGGA-693 cohort, which included 604 patients in m7Gcluster-A and 371 cases in m7Gcluster-B. E GSVA of biological pathways between two distinct subgroups

