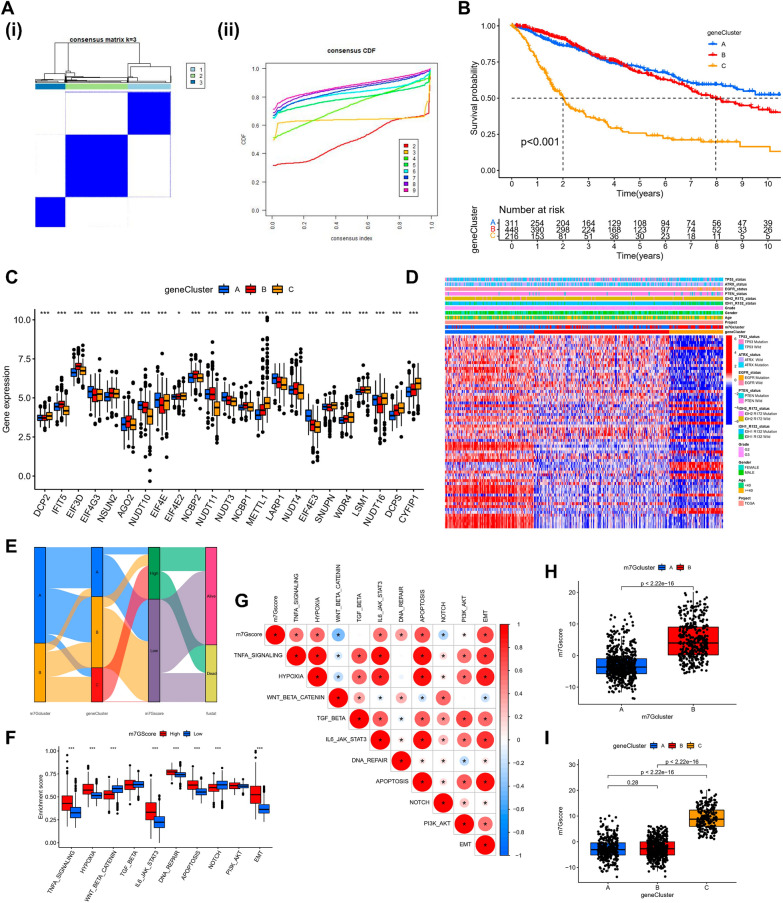
Fig. 4.
m7G scores and phenotypic identification of genes linked to m7G. A (i) The consensus matrix for k = 3 generated by means of consensus clustering is shown by the heatmap (ii) Relative change in consensus CDF area under the curve for k = 2 to 9. B Various gene cluster-related survival curves (p < 0.001, Log-rank test). C The differential expression of genes linked to m7G among several gene clusters. *** p < 0.001, ** p < 0.01, * p < 0.05. To examine the statistical variations across the three gene clusters, the one-way ANOVA test was applied. D Heat map of genetic modification patterns. E Sankey diagrams illustrating several genotypes. F Differential expression of Hallmark pathway characteristics between high-m7G score and low-m7G score. * * * p < 0.001. G Relationship between immune cells and m7G scores, with red denoting a positive correlation and blue denoting an inverse correlation. H m7G score’s differential expression within the m7G cluster (p < 0.001). I m7G score’s difference analysis in the gene cluster (Kruskal–Wallis test)

