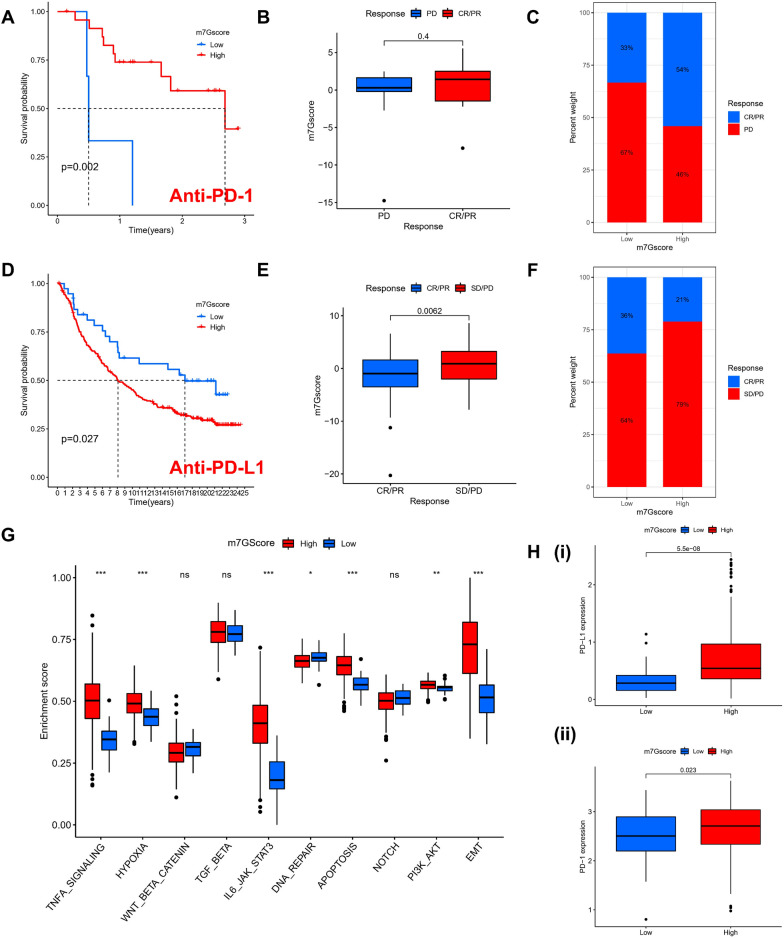
Fig. 6.
The assessment of immunotherapy response by the m7G score signature in the Anti-PD-1 and Anti-PD-L1 cohort. A The Kaplan–Meier curve analysis of high- and low-risk m7G score in the Anti-PD-1 cohort. B The comparison of the m7G score between individuals making complete/partial response (CR/PR) and those who kept a stable/progressive disease (SD/PD). C The proportion of individuals with LGG made complete/partial response (CR/PR) or kept a stable/progressive disease (SD/PD) in high- and low-risk m7G scores. D The Kaplan–Meier curve analysis between high- and low-risk m7G score in the Anti-PD-L1 cohort. E Comparing m7G scores between subjects making CR/PR and the subjects who kept an SD/PD in the Anti-PD-L1 cohort. F The proportion of individuals with LGG made CR/PR or kept an SD/PD in high- and low-risk m7G score of the Anti-PD-L1 cohort

