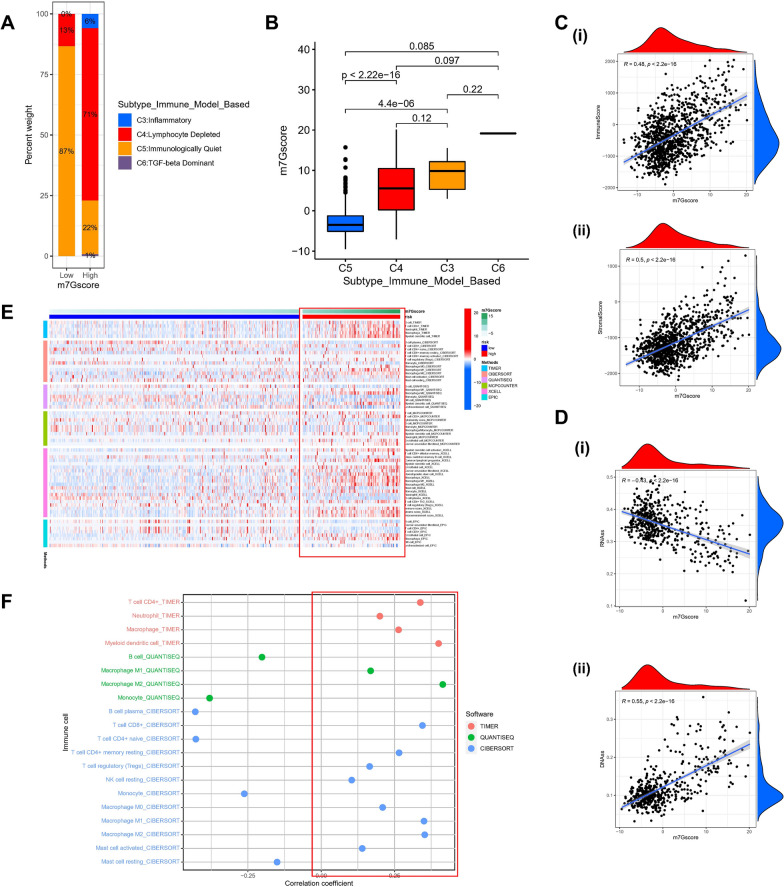
Fig. 7.
Identification of tumor immune microenvironment across high and low-risk m7G score groups. A. The proportion of LGG patients among C3 (inflammatory), C4 (lymphocyte depleted), C5 (immunologically quiet), and C6 (TGF-β Dominant) subtype immune model according to high- and low-risk m7G score. B. The comparison of the m7G score among C3、C4、C5、C6. C. (i) The correlation between m7Gscore and the Immune Score. (ii) The link between m7Gsocre and the stromal score. D. (i) The correlation between m7Gscore and the RNAs. (ii) The correlation between m7Gsocre and the DNAss (p < 0.001). E. Heatmap for immune responses by means of CIBERSORT, TIMER, QUANTISEQ, MCPCOUNTER, XCELL, and EPIC algorithms among high- m7Gscore group and low- m7Gscore group. F. The relationship between immune cells and m7Gscore. Each color represented a distinct algorithm

