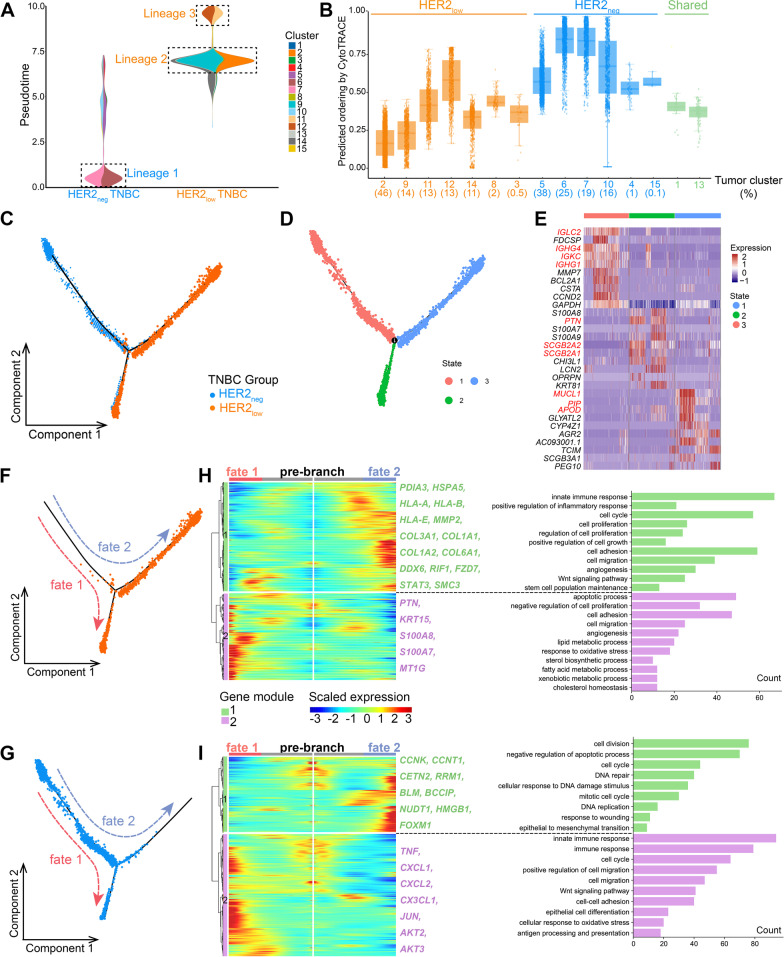
Fig. 3.
Different dynamic evolutionary characteristics of tumor cells in HER2low and HER2neg TNBC. (A) Density of tumor cells along pseudotime in two TNBC groups. The vertical axis is the pseudotime process from bottom to top, the horizontal axis is the composition of cell clusters at different pseudotime state (displayed by TNBC groups). The main tumor clusters of the two groups have been annotated, diverging from early to late lineages 1,2, and 3, respectively. (B) The box plot shows the differentiation status of each tumor cell subcluster using CytoTRACE. Tumor clusters marked in blue and orange fonts are specific clusters of HER2neg and HER2low TNBC, respectively, and the clusters marked in green font are shared by the two TNBC groups. (C) Trajectory of the evolution of tumor cells predicted by monocle. The dashed arrows indicate the direction of evolution. (D) Three states of tumor evolution in all tumor cells. From State 1 to State 3 indicates that tumor cell evolution from early to late stages. (E) Heatmap indicates the gene expression signatures of the three evolutionary states. (F) Trajectory reconstructions of tumor cells in the HER2low TNBC and (G) HER2neg TNBC, respectively, revealing three branches including pre-branch, fate 1, and fate 2. (H) Heatmaps show upregulated or downregulated genes along with the two differentiation fates and the GO enrichment analysis in HER2low and (I) HER2neg TNBC groups, indicating active signature pathways for each branch in two groups. The abscissa is from the middle to the left and right sides (fate 1, fate 2), representing the tumor evolution process from early to late; the ordinate represents the gene, and each point represents the average expression of the specified gene in the pseudotime. Genes with similar expression patterns are clustered into one module

