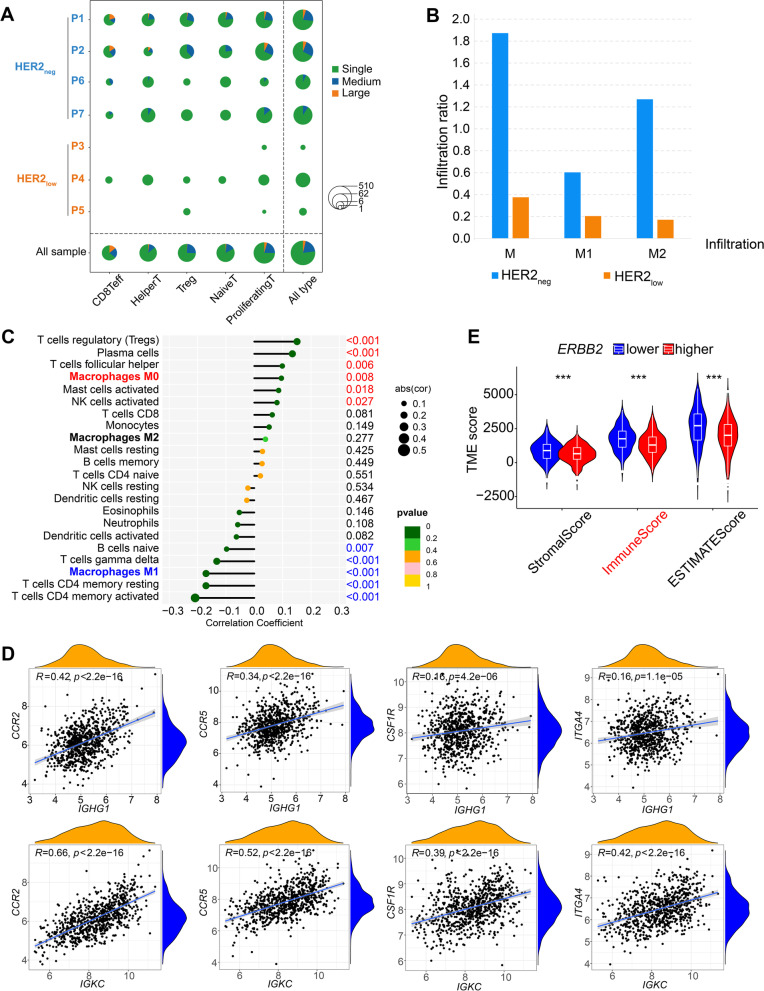
Fig. 5.
Distinct patterns of immune cell characteristics between HER2low TNBC and HER2neg TNBC. (A) scTCR-seq analysis shows TCR diversity in HER2neg TNBC and HER2low TNBC. The horizontal axis lists T cell types, and the vertical axis shows individual samples and TNBC groupings. Different colors represent different frequencies of TCR clonotypes. Single, unique TCR clonotypes; medium, TCR clonotypes with a frequency between 1 and 10; large, TCR clonotypes with a frequency > 10.The size of the circle represents the number of T cells. (B) Bar plot shows infiltration levels of different macrophages in HER2neg and HER2low TNBC groups. M, all macrophages; M1, M1 macrophages; M2, M2 macrophages. (C) Correlations between ERBB2 mRNA expression level and various immune cell functions in TNBC (GSE76124, GSE95700, GSE103091, GSE135565, GSE157284 and GSE167213). P, Spearman correlation analysis; the numbers on the right are p values; p values in red indicate a significant positive correlation, while those in blue indicate a significant negative correlation. (D) Correlations between the expressions of characteristic immunoglobulin genes (IGHG1, IGKC) and the signature molecules in macrophage recruitment (CCR2, CCR5, CSF1R, ITGA4), using Spearman correlation analysis; P < 0.05 indicates statistical significance. (E) Comparison of immune scores in TNBC samples with different ERBB2 expression levels. The median expression level of ERBB2 was used as the cut-off value

