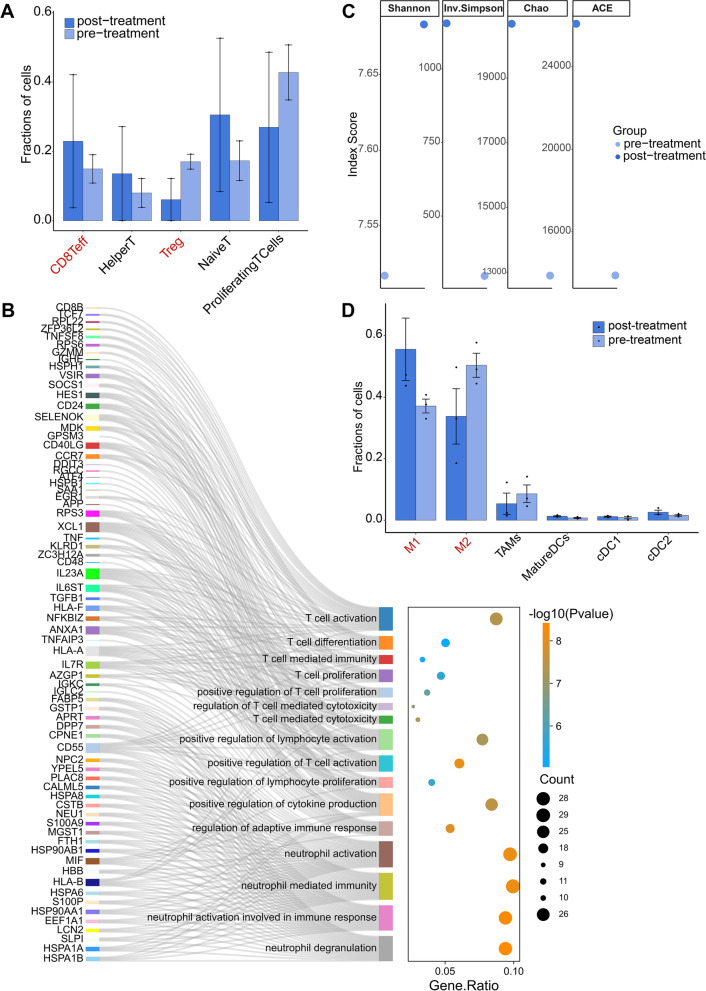
Fig. 6.
Characteristic changes of immune microenvironment in HER2neg TNBC patients before and after neoadjuvant immunotherapy. (A) Comparison of the abundance of the subclusters of T cells before and after treatment of HER2neg TNBC. CD8Teff, CD8+ effector T cells; HelperT, CD4+ helper T cells. (B) Pathway enrichment analysis of up-regulated genes in T cells after neoadjuvant immunotherapy in HER2neg TNBC compared with treatment-naïve T cells. (C) ScTCR-seq analysis in HER2neg TNBC before and after treatment by four different scoring methods. (D) Comparison of the abundance of the subclusters of microphages before and after treatment in HER2neg TNBC patients. M1, M1 microphages; M2, M2 microphages; TAMs, tumor-associated microphages; MatureDCs, Mature dendritic cells; cDC, classical dendritic cells

