Fig. 2.
circACTR2 is negatively associated with aggressive cell phenotype and poor prognosis
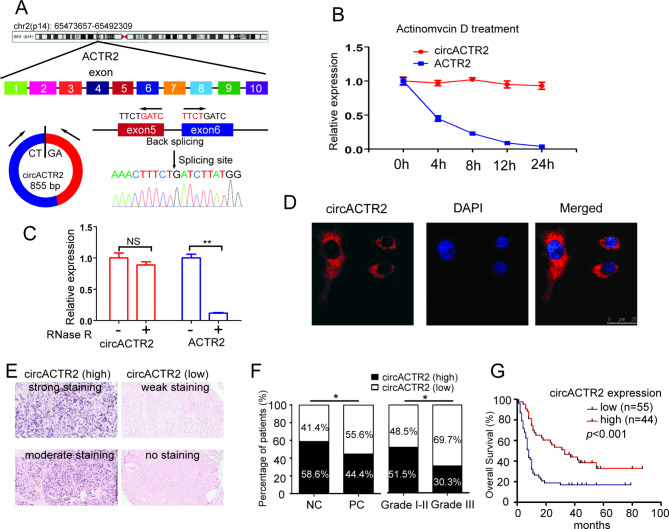
A circACTR2 information from the UCSC Genome Browser. The amplified product was sequenced using Sanger sequencing to validate the circularized junction of circACTR2. B qRT-PCR analysis of circACTR2 and ACTR2 mRNA in SW1990 cells with actinomycin D treatment for 30 min at 37 °C. C qRT-PCR analysis of circACTR2 and ACTR2 mRNA in SW1990 cells treated with RNase R. D FISH images showed that circACTR2 labeled with Cy3 (red) was mainly distributed in the cytoplasm of SW1990 cells. The nuclei was stained with DAPI (blue). Scale bar, 25 μm. E Representative images of circACTR2 expression in PC tissues were detected by ISH. F Percentages of specimen with low or high expression of circACTR2 in PC compared with NP tissues and in PC tissues with different pathological grade. G Kaplan-Meier’s analyze of correlation between circACTR2 expression level and overall survival of patients with PC (n = 99, p < 0.01, log-rank test). *P < 0.05; **P < 0.01

