
Figure 6.
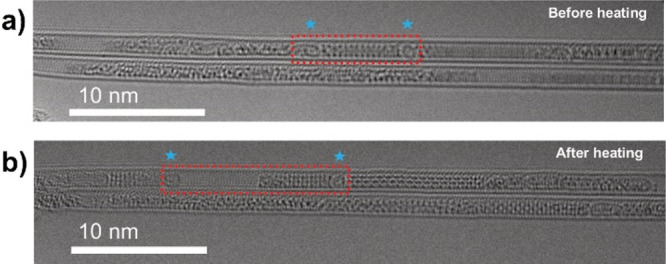
AC-TEM analysis of β-In2Se3 before and after heating to 400 °C. (a, b) AC-TEM images of a β-In2Se3 nanoribbon after heating to 23 and 400 °C, respectively. Red boxes represent the nanoribbon of interest, before and after heating. Blue stars are positioned above two fullerene-like molecules which “cap” the nanoribbon of interest.