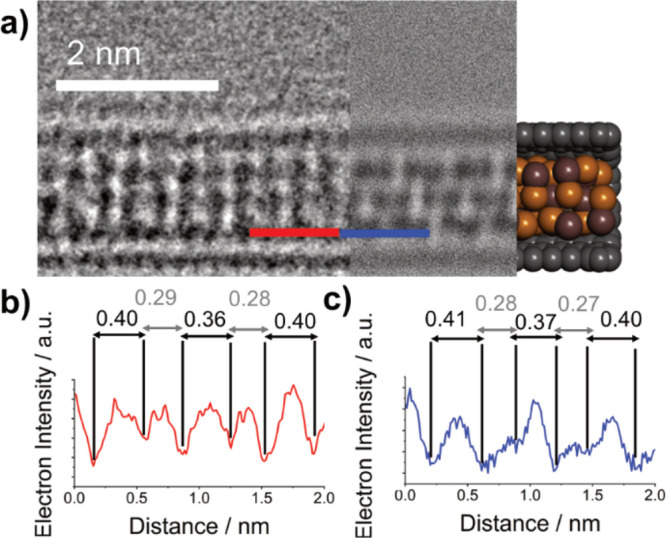
Figure 8.

(a) Three-part composite image of a γ-In2Se3 nanowire inside a SWCNT viewed along the (120) plane, consisting of an AC-TEM image (left), a simulated TEM image (center), and a molecular model (right). (b, c) Electron density profile maps in red, generated from red line superimposed over the experimental AC-TEM image in (a), and in blue, generated from the blue line superimposed over the simulated TEM image in (b), with calculated interatomic distances highlighted in nm.
