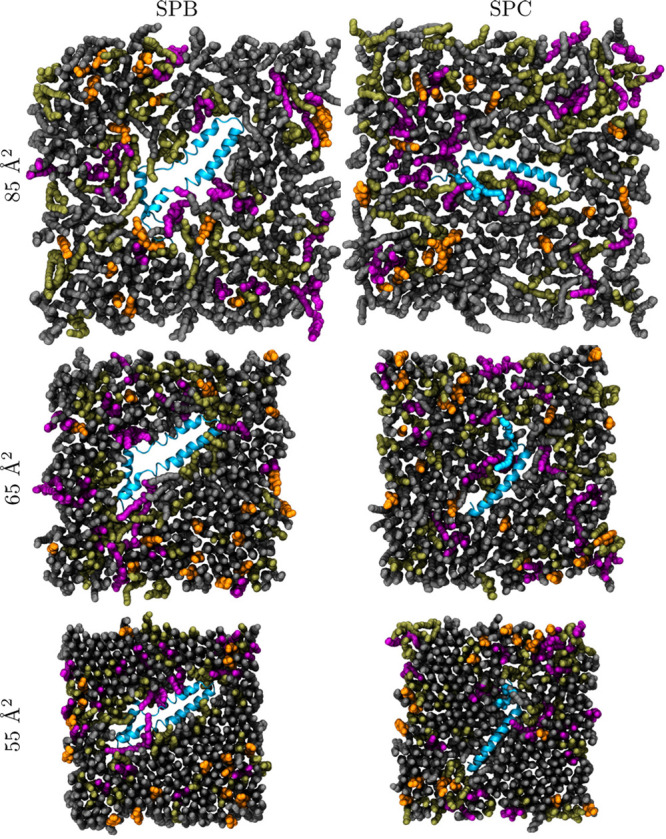
Figure 1.

Simulation snapshots. The monolayers are depicted from the air (vacuum) side of the interface. DPPC is shown in gray, POPC in olive green, POPG in purple, and CHOL in orange. Water molecules and hydrogen atoms of lipids are not shown for clarity. The proteins are shown in blue with the ribbon representation.
