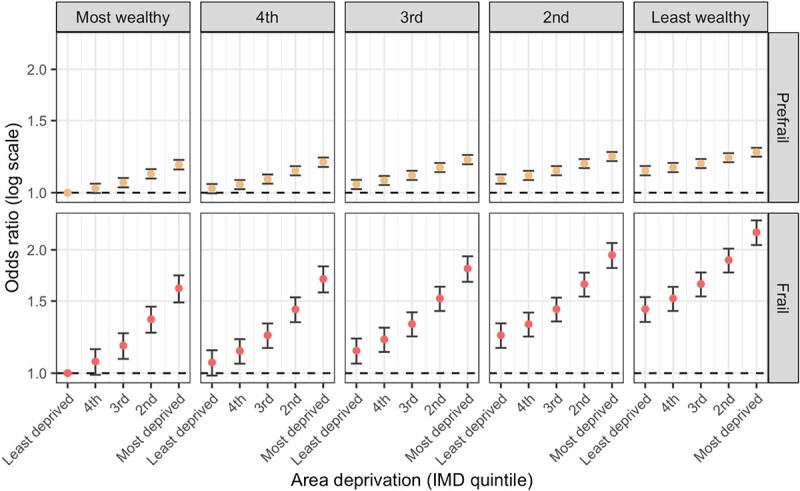
Figure 1.

AORs of prefrailty and frailty for each deprivation quintiles, relative to the most advantage individuals (the most wealthy living in the least deprived areas). Models are adjusted for age, gender, ethnicity, education level, marital status, smoking and drinking behaviour. Error bars show 95% CI. Source: ELSA waves 1–8.
