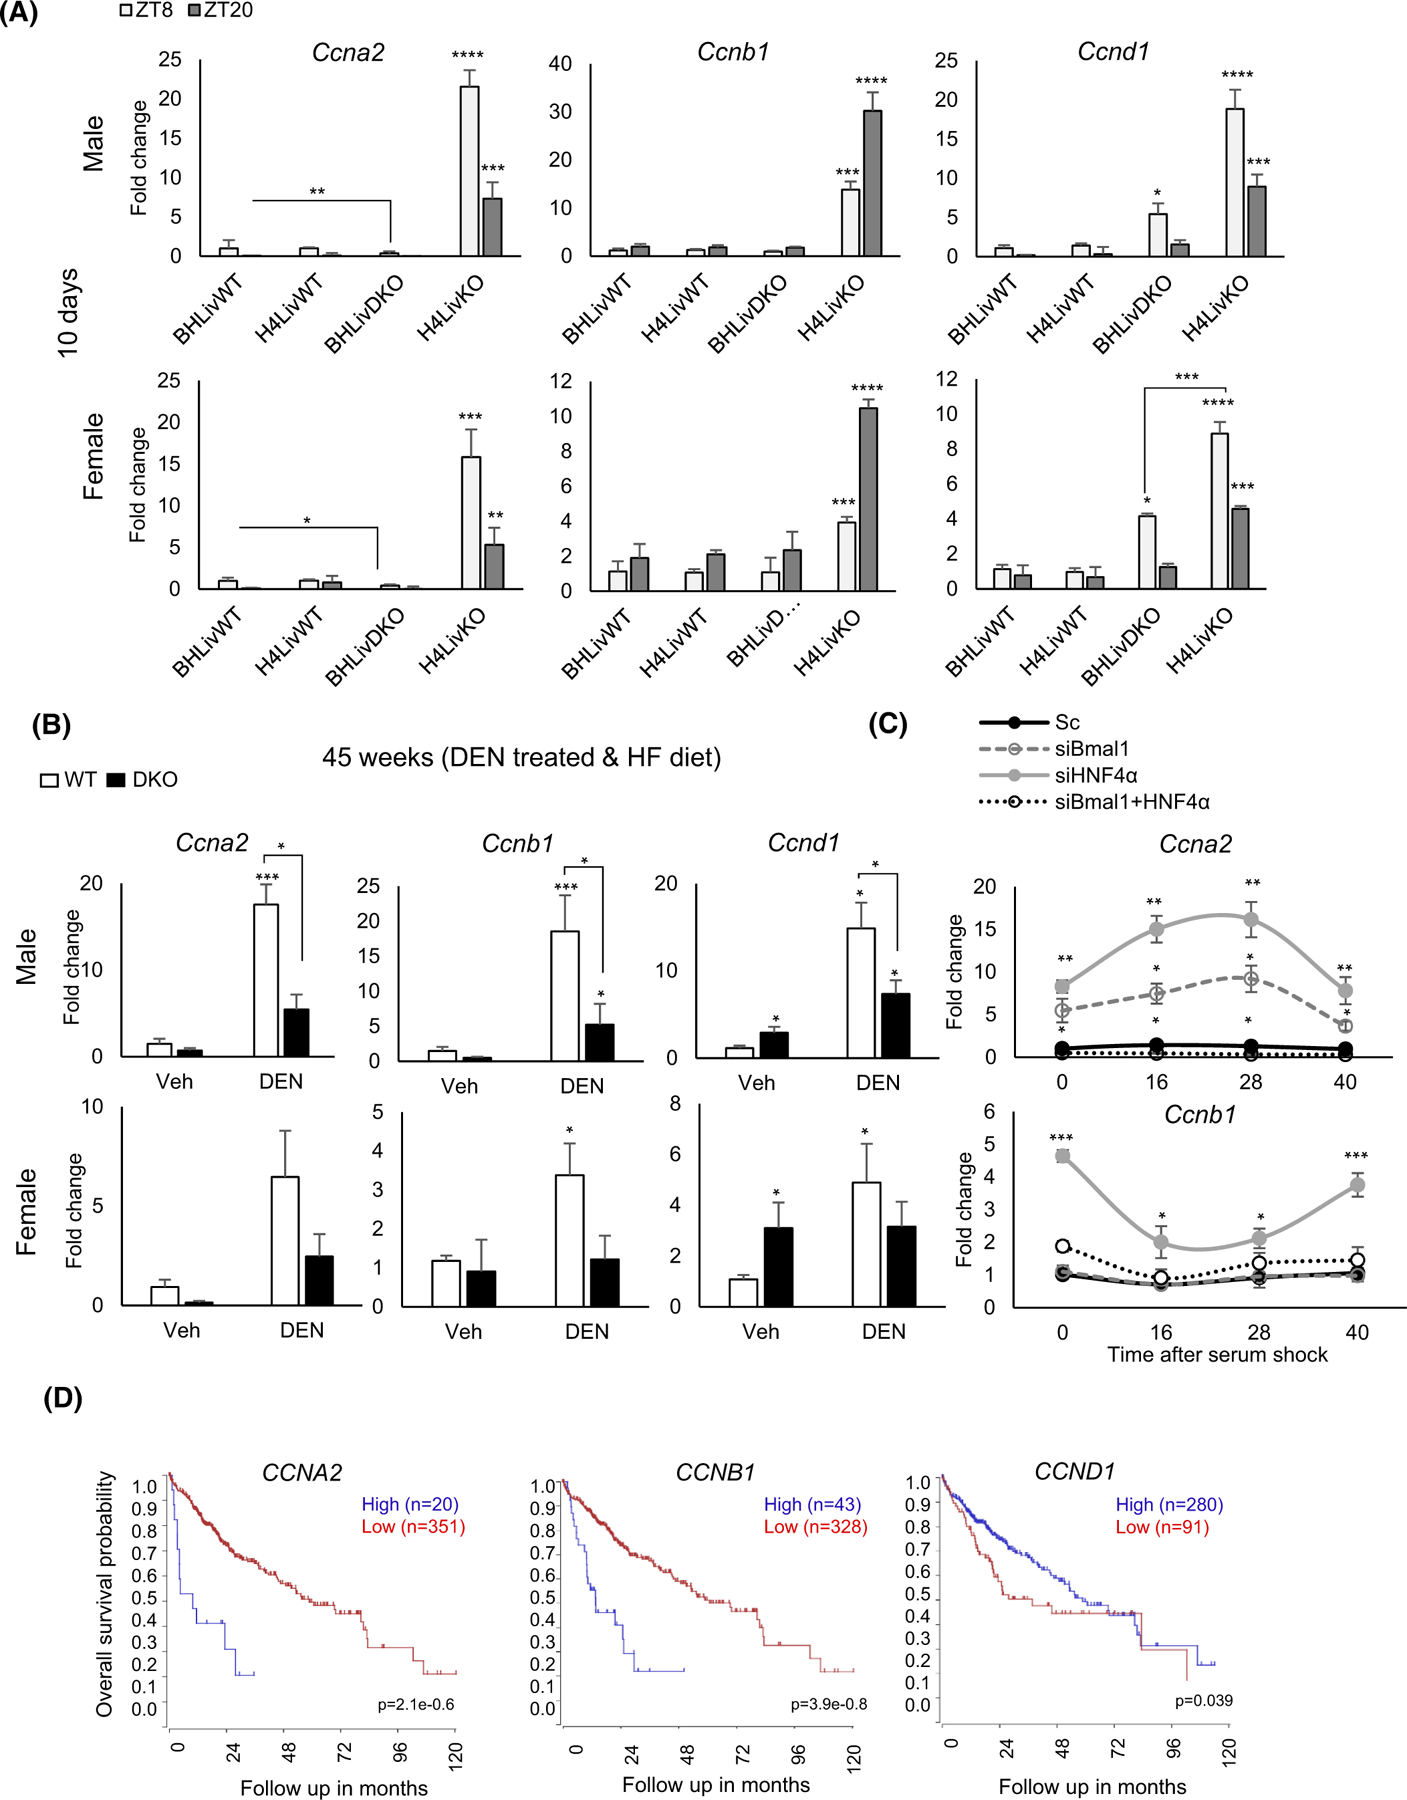
FIGURE 5.

Expression of cyclin genes is significantly reduced in BHLivDKO mice compared to H4LivKO mice. (A) qPCR analysis shows expression of cyclin genes Ccnd1, Ccnb1 and Ccna2 10 days post-tamoxifen injection. Two-way ANOVA, Sidak’s multiple comparisons test (N = 6–8): *p < .03; **p < .005; ***p < .0005, ****p < .0001. (B) qPCR analysis of cyclin genes after DEN and HFD treatment, Two-way ANOVA, Sidak’s multiple comparisons test (N = 8–12): *p < .03; ***p < .0005. (C) Cyclin A2 (Ccna2) expression in Aml12 cells following knockdown of Bmal1, Hnf4α, or both Bmal1 and Hnf4α using siRNA at 0,16, 20, and 40 h post-serum shock. Scrambled oligonucleotide (Sc) was used as a control. Two-way ANOVA, Sidak’s multiple comparisons test (N = 10): *p < .03; **p < .005; ***p < .0005, ****p < .0001. (D) Survival curves show CCNA2, CCNB1, CCND1 genes expression using the tumor liver hepatocellular carcinoma (TCGA) LIHC dataset using the R2 Genomics Analysis and Visualization Platform (http://r2.amc.nl). Survival time measured from the time of initial diagnosis to the date of death or the date of last follow up. The survival distribution estimated by Kaplan–Meier method. p-values <.05 were considered to be statistically significant.
