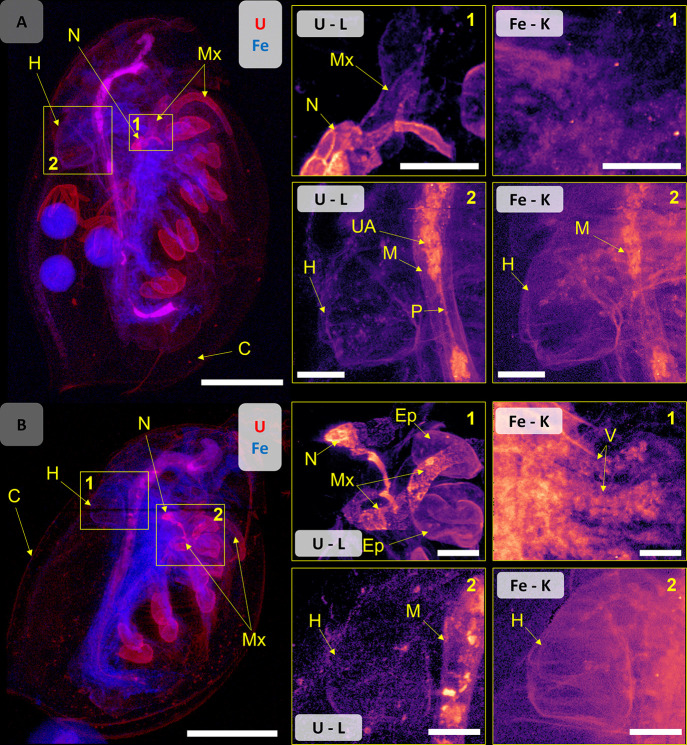
Figure 3.
Composite map of U (red) and Fe (blue) of (A) UNP-exposed D. magna (320 μg U L–1) and (B) Uref-exposed organism (159 μg U L–1). High-resolution (2 μm) ROI maps showing the maxillary gland and nephridium (region 1) and the heart (region 2). Scale bars represent 500 μm on the whole daphnid maps and 100 μm on the ROI maps. Elemental signal intensities are in logarithmic scale. Abbreviations: vesicle (V), maxillary gland (Mx), nephridium (N), epipodite (Ep), UNP aggregates (UA), midgut (M), peritrophic membrane (P), heart (H), and carapace (C).

