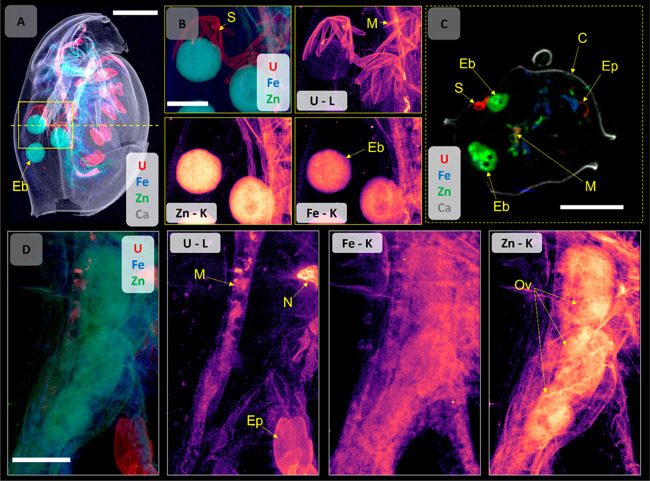
Figure 4.
(A) Overview, combined elemental map (5 μm step size) of a UNP (320 μg U L–1)-exposed D. magna for U, Ca, Fe, and Zn distributions, indicating the ROI area chosen for 2 μm high-resolution mapping (yellow box) and the location of the tomographic section (yellow dotted line). (B) Elemental distribution (combined and individual maps) on the ROI showing the U-bearing chorion structures and embryos in the brood chamber. The U distribution map in intensity scale can be found in Figures S14 and S15). (C) A tomographic section (2 μm resolution) showing the distributions of U, Fe, Zn, and Ca in the brood chamber, including the U-bearing structures and embryos. (D) High-resolution elemental distribution maps (combined and individual) for U, Fe, and Zn of a ROI on the ovary of a Uref-exposed D. magna (159 μg U L–1, see Figure 2A for whole organism), where U is not observed in the developing embryo. Elemental signal intensities are in logarithmic scale. Scale bars represent 500 μm (A, C) and 200 μm (B, D). Abbreviations: embryo (Eb), chorion structures (S), midgut (M), epipodite (Ep), carapace (C), nephridium (N), and ovary (Ov).

