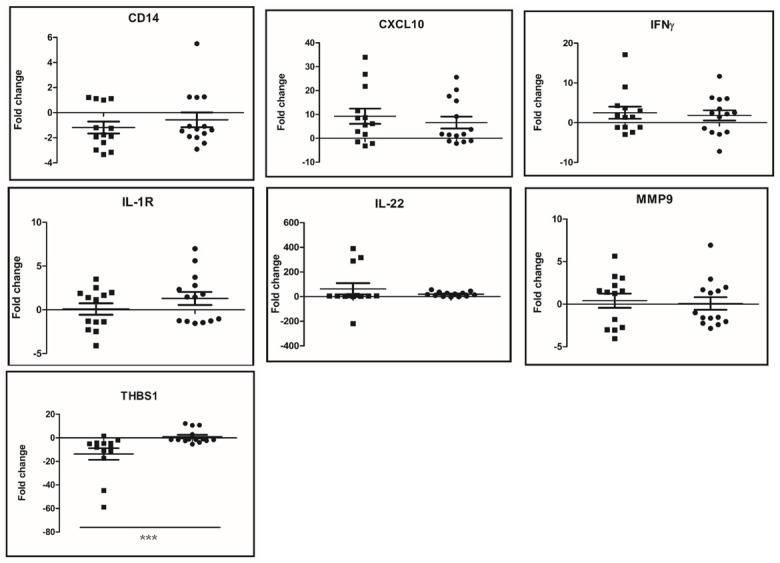
Fig. 1.

Fold changes of gene transcription in PBMCs from PTB+ and healthy animals upon PPDa stimulation. Fold change values from individual animals are represented by squares (PTB+ animals) and circles (healthy animals). Median and interquartile ranges are shown. Relative gene transcription was calculated with the 2-ΔΔCt method with E correction and using glyceraldehyde 3-phosphate dehydrogenase mRNA as the reference gene and the non-stimulated condition as the calibrator. Data were analysed using a two-tailed unpaired Mann-Whitney test CD14 – Cluster of differentiation 14; CXCL10 – C-X-C motif chemokine ligand 10; PTB – paratuberculosis; IFN-γ – interferon gamma; IL-1R – interleukin 1 receptor; IL-22 – interleukin 22; MMP9 – matrix metallopeptidase 9; THBS1 – thrombospondin 1; *** – P < 0.001
