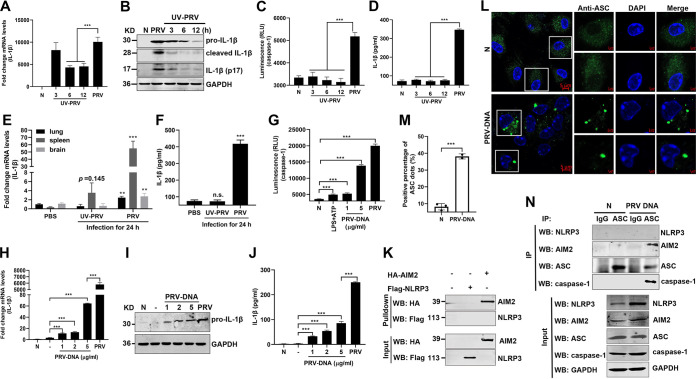
FIG 9.
PRV genomic DNA activates AIM2 inflammasome to induce IL-1β secretion in vitro and in vivo. (A to D) Mouse peritoneal macrophages were mock infected or infected with PRV or infected with UV-inactivated PRV (UV inactivated for 3, 6, or 12 h, respectively) at MOI of 10 for 12 h. The mRNA levels of pro-IL-1β and the protein levels of pro-IL-1β, cleaved IL-1β, and activated IL-1β (p17) in the cell lysates were measured by qPCR (A) and Western blot analysis (B), respectively. The caspase-1 activity in cell lysates and the secreted IL-1β in the cell supernatants were analyzed by Caspase-Glo 1 inflammasome assay kits (C) and ELISA (D), respectively. (E, F) WT mice were infected with PRV or UV-inactivated PRV at 2,000 PFU/mouse by tail vein injection for 24 h. (E) The mRNA levels of IL-1β in the tissues were analyzed with qPCR. (F) The secretion level of IL-1β in serum was detected by ELISA. (G to J) PRV genomic DNA was extracted and transfected into mouse peritoneal macrophages at 1, 2, and 5 μg/mL for 24 h. The active caspase-1 in cell lysates was also analyzed (G). The mRNA, protein, and secreted levels of IL-1β were measured by qPCR (H), Western blotting (I), and ELISA (J), respectively. (K) HEK293T cells were transfected with pCAGGS-Flag-Nlrp3 or pCAGGS-HA-Aim2 for 24 h. Cell lysates were harvested and coincubated with biotinylated PRV genomic DNA (10 μg) at 4°C for 12 h. Streptavidin-Sepharose beads were then added and rotated at 4°C for 4 h. The beads were washed and analyzed by immunoblotting with the indicated antibodies. (L to N) PRV genomic DNA was transfected into mouse peritoneal macrophages at 2 μg/mL for 24 h. (L, M) The ASC oligomerization was examined with anti-ASC mAb under confocal microscopy, and the cell lysates were coimmunoprecipitated with anti-ASC mAb or mouse IgG. (N) The immunoprecipitants and whole-cell lysates were detected with anti-NLRP3, AIM2, ASC, caspase-1, and GAPDH antibodies. The scale bars represent 5 μm. Data are representative of three independent experiments with three biological replicates (mean ± SD in panels A, C to H, and J and one-way ANOVA in panels A, C to H, and J). **, 0.001 < P < 0.01; ***, P < 0.001.

