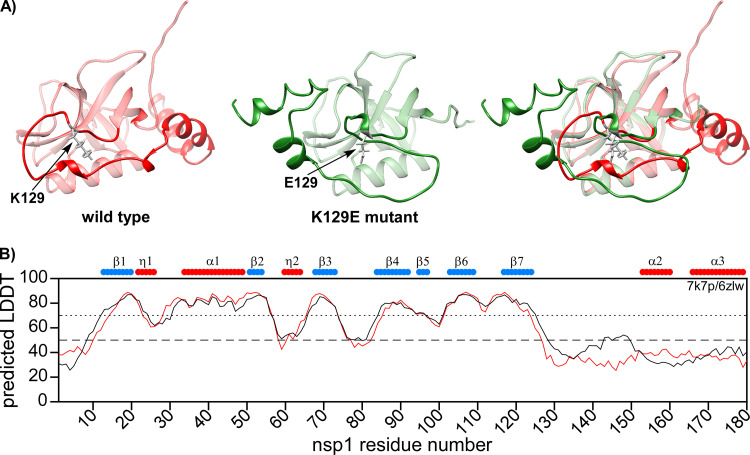
FIG 12.
Predicted structures of wt SARS-CoV-2 nsp1 and K129E mutant. (A) ColabFold v1.1 structure prediction of the full-length wt nsp1 (red) and K129E mutant (green). The N-terminal folded domains are presented as transparent. The sites of K129 and E129 are colored in gray. (B) The predicted LDDT plot. Wt nsp1 and K129E mutant are represented by black and red lines, respectively. The schematic representations of the previously determined secondary structures are shown on the top of the panel.

