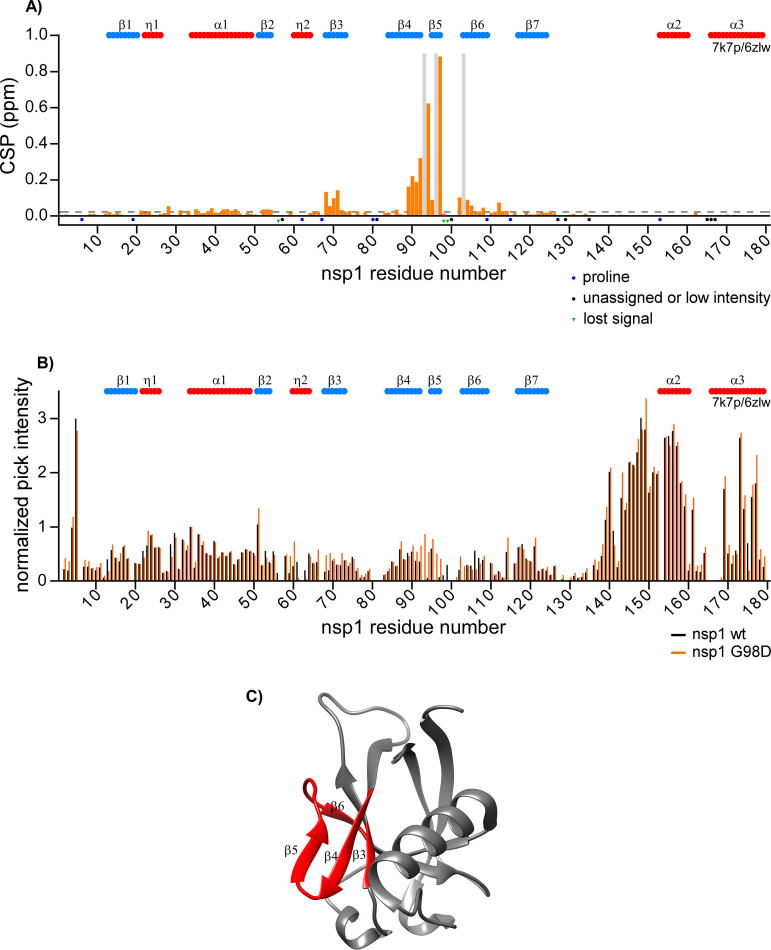
FIG 8.
Comparison of wt SARS-CoV-2 nsp1 versus G98D mutant. (A) Chemical shift perturbations (CSP) of the amide bonds (1H and 15N nuclei) in the 15N-labeled wt nsp1 versus G98D mutant are presented as orange bars. The unassigned resonances and prolines are indicated by black and blue dots, respectively. The resonances observed only in the wt or in the mutant nsp1 are indicated by green dots and gray bars, respectively. The threshold of CSP values is indicated as a dashed line at the level of two standard deviations (2σ). (B) Normalized intensities of the cross peaks in 1H-15N TROSY spectra of wt nsp1 and G98D mutant are presented as black and orange bars, respectively. The previously determined elements of the secondary structures are presented on the tops of panels A and B. They were adapted from the X-ray data of the folded N-terminal domain of nsp1 (residues 10 to 124, PDB ID: 7k7p [20]) and from the CryoEM data of full-length nsp1 bound to the 40S ribosomal subunit (residues 153 to 179, PDB ID: 6zlw [11]). The β-strands and helices/turns are labeled in blue and red, respectively. (C) Crystal structure (PDB ID: 7k7p) of the folded domain of wt nsp1. The structural elements exhibiting CSP values in G98D mutant that are larger than the threshold are labeled in red.

