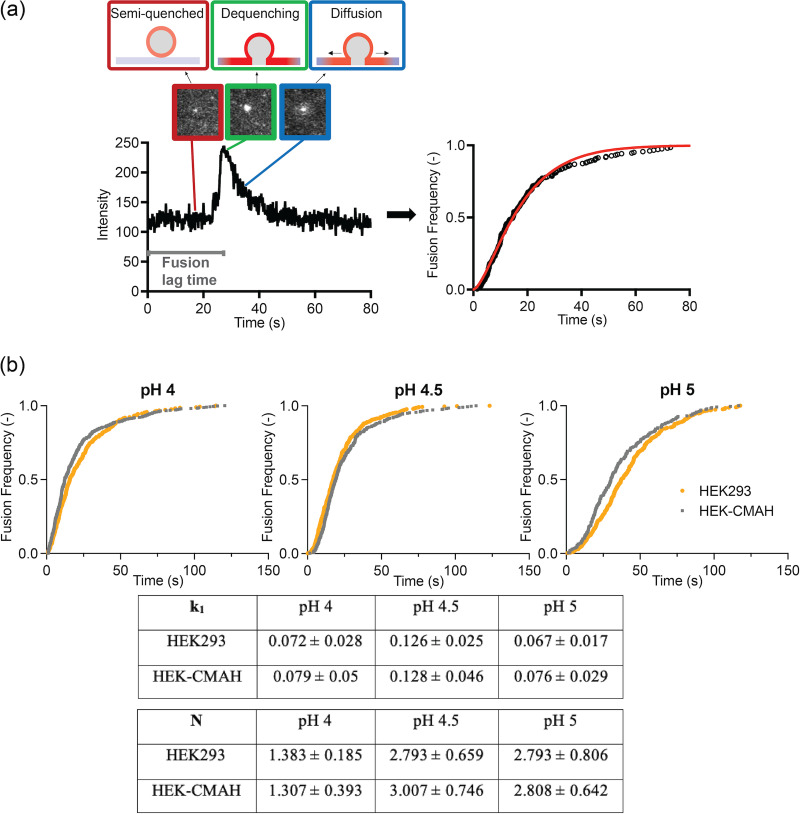
FIG 6.
H3N2 (X-31) virus fusion kinetics using single particle tracking. (a) Overview of a single H3N2 influenza virus fusion event. The system is acidified to trigger fusion which leads to a spike in R18 intensity due to fluorescence dequenching. Fluorescence intensity then decreases as the fluorophores diffuse out from the site. The lag time between acidification and fusion is the fusion lag time, which is collected from multiple events and plotted as a cumulative distribution curve. Data are fitted to an equation to obtain fusion kinetics, k1 and N. (b) Cumulative distribution curves and fusion kinetics of H3N2 in HEK293- and HEK-CMAH-SLBs at a pH range from 4 to 5. Data were analyzed using MATLAB and Prism software.

