FIG 2.
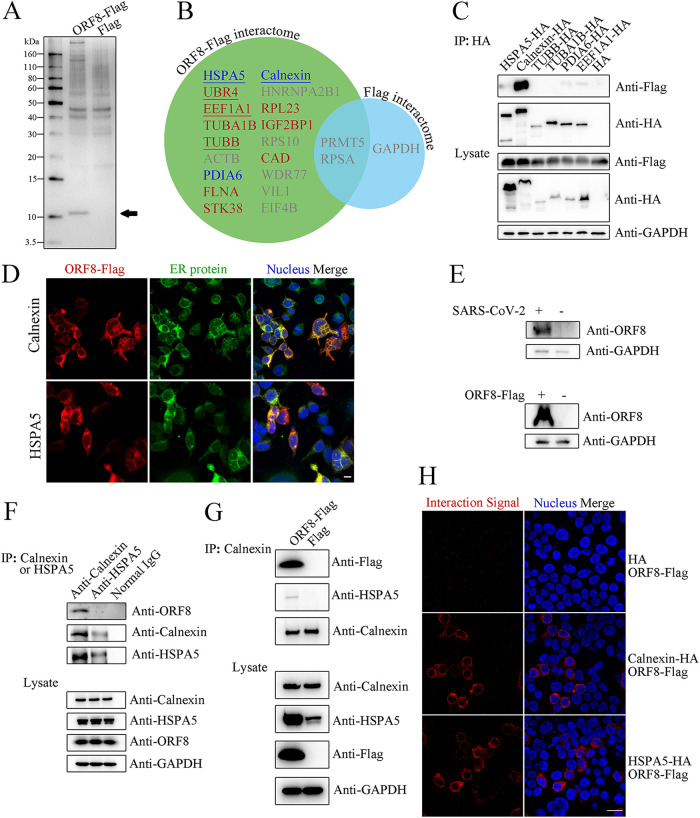
ORF8 interacts with Calnexin and HSPA5. (A) Products of anti-Flag immunoprecipitation. The immunoprecipitation products from ORF8-Flag- or Flag-overexpressing 293T cell lysates were analyzed by SDS–PAGE with silver staining. The predicted ORF8-Flag band is marked with a black arrow. (B) The ORF8-Flag interactome (in green circle) identified and compared to the Flag interactome (in blue circle). ORF8-interacting proteins predicted to be located in the ER/not in the ER are indicated in blue and red texts, respectively; underscored: ORF8-interacting proteins identified in replicated experiments; gray text: proteins identified with fewer than 2 unique peptides or proteins identified in the control. (C) ORF8 interacts with Calnexin and HSPA5. ORF8-Flag, with each of the interacting protein candidates with an HA tag, was exogenously overexpressed in 293T cells. The products of anti-HA immunoprecipitation were analyzed by WB. (D) Colocalization between ORF8 and endogenous Calnexin/HSPA5. ORF8-Flag-overexpressing 293T cells were analyzed by multiimmunofluorescence using anti-Flag and anti-Calnexin (upper)/anti-HSPA5 (lower) antibodies. Left column: ORF8-Flag signals in red; middle column: ER proteins Calnexin and HSPA5 signals in green; right column: merged signals of left and middle with nucleus in blue. Scale bar: 15 μm. (E) Identification of endogenous (upper) and exogenous (lower) ORF8 by WB using a homemade antiserum. As the a sample for the endogenous WB assay, HeLaACE2+ cells were infected with SARS-CoV-2 at a multiplicity of infection (MOI) of 0.01 for 48 h. (F) Interaction between endogenous ORF8 and Calnexin/HSPA5. HeLaACE2+ cells were infected with SARS-CoV-2 (at an MOI of 0.1) for 48 h, and the product of either anti-Calnexin (left lane) or anti-HSPA5 (mid lane) immunoprecipitation was analyzed by WB. (G) Identification of a Calnexin-ORF8-HSPA5 heterotrimer. Immunoprecipitation products of ORF8-Flag-overexpressing 293T cells were analyzed by WB. (H) Interaction between ORF8 and Calnexin/HSPA5 by PLA. The HA tag with ORF8-Flag (upper), Calnexin-HA with ORF8-Flag (middle), or HSPA5-HA with ORF8-Flag (lower) was coexpressed in 293T cells, and PLAs were performed to identify the interaction of coexpressed targets. Left column: interaction signals in red; right column: merged signals of interaction and nucleus (in blue) signals. Scale bar: 25 μm.

