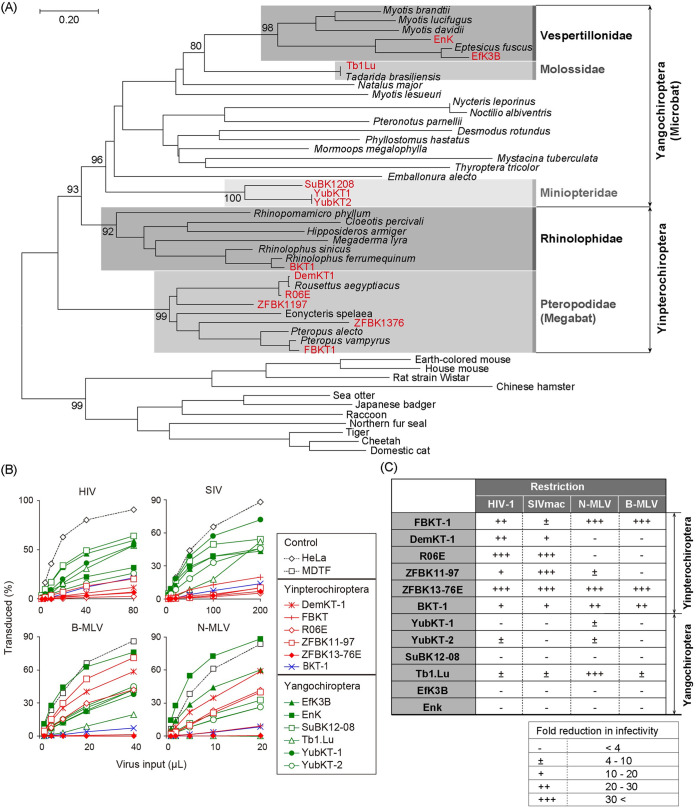
FIG 1.
Susceptibility of bat cell lines to retroviral infection. (A) Phylogeny of bats and other mammals. Phylogenetic relationships between the bats investigated in this study and representative bat species are shown. A maximum-likelihood (ML) phylogenetic tree was constructed based on the full-length amino acid sequences of the mitochondrial cytochrome b gene. The cytochrome b sequences of other mammals obtained from GenBank (accession numbers in Table S1) were included as an outgroup. The bat cell lines utilized in this study are highlighted in boldface red letters. Bat families which include the cell lines analyzed in this study are shaded with different densities of gray and are indicated for the phylogenetic clades with the cell lines studied. Numbers at the nodes of the main clusters indicate the bootstrap percentages (%) generated from 1,000 repeats (if it is ≥80). (B) Lineage-dependent susceptibility of bat cell lines to retrovirus infection. Fold-reductions of virus infectivity in each bat cell line compared to control cells are shown. The proportion of green fluorescent protein (GFP)-positive cells was measured 48 h after infection by flow cytometry. Red, blue, and green lines and symbols indicate cell lines derived from bats within the family Pteropodidae (megabat), the family Rhinolophidae, and the suborder Yangochiroptera, respectively. All cell lines were inoculated with a tester virus in parallel. Since the variation in GFP positivity between multiplicated wells was too small to exhibit standard deviation (SD) in this experimental setting, the titration experiments were performed in single wells; however, each virus inoculation was repeated three times independently. Results from three independent experiments are shown. (C) Summary of fold-reductions in retroviral infectivity in bat cell lines. Fold-reductions in retroviral infectivity compared to control cell lines (HeLa for lentiviral infection and Mus dunni tail fibroblast [MDTF] cell line for murine leukemia virus [MLV] infection) were calculated at virus titers which resulted in 20% to 30% GFP positivity in control cells. Restriction is indicated as –, <4-fold reduction; ±, 4- to 10-fold; +, 10- to 20-fold; ++, 20- to 30-fold; and +++, >30-fold.

